Figure 3.

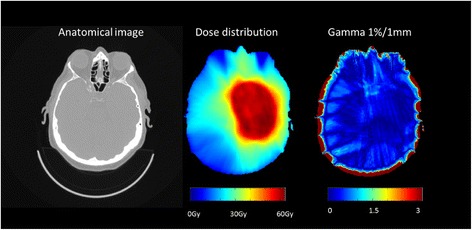
Anatomical CT image, dose distribution and gamma map for a representative slice of the patient with the largest observed dosimetric errors. The high dose region extends into the ethmoidal and sphenoidal sinuses.

Anatomical CT image, dose distribution and gamma map for a representative slice of the patient with the largest observed dosimetric errors. The high dose region extends into the ethmoidal and sphenoidal sinuses.