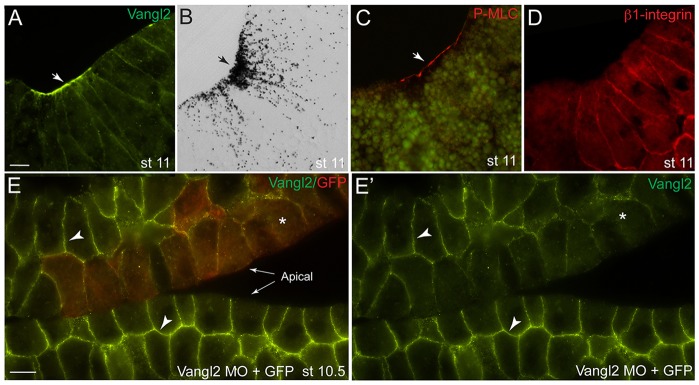
Fig. 1.

Subcellular distribution of Vangl2 at the blastopore lip. (A-D) Parasagittal sections of stage (st) 11 embryos showing the blastopore area (arrows). (A) Immunohistochemical staining demonstrating apical and basolateral localization of endogenous Vangl2. (B) Bright-field view of a similar embryo section shows extensive pigmentation in the constricting blastopore cells. (C) Staining with antibodies against pMLC. (D) Basolateral localization of β1-integrin in bottle cells. (E,E′) Subcellular distribution of Vangl2 in the superficial and the inner ectoderm cells. (E) Mosaic distribution of Vangl2 MO with GFP RNA as a lineage tracer (red) confirms Vangl2 antibody specificity. (E′) Green channel only. Arrowheads point to Vangl2 staining in E,E′; asterisks indicate lack of staining. Two embryo sections are shown side-by-side to illustrate Vangl2 depletion. Scale bars: 20 µm.
