
Fig. 4.
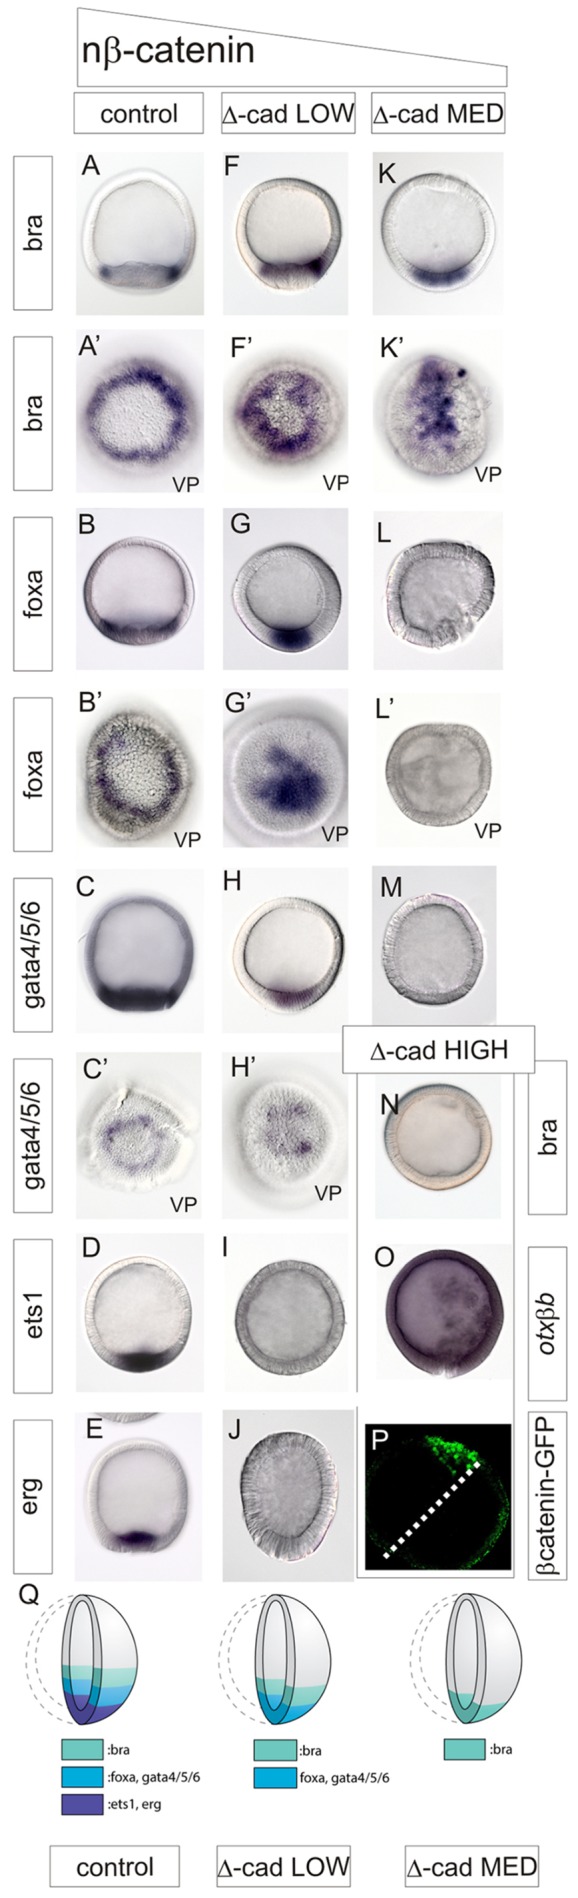
Progressive loss of mesoderm, then of endoderm, with decreasing levels of nβ-catenin. Localization of transcripts shown boxed on right or left as visualized by WMISH in 24 h-blastulae that were injected at single cell-stage, with GFP as a control (A-E), low levels of Δ-cadherin (F-J), medium levels of Δ-cadherin (K-M) or high levels of Δ-cadherin (N,O). (P) A 24 h-embryo that was injected at the one-cell stage with β-catenin:GFP and additionally in a single cell at the two-blastomere stage with high levels of Δ-cadherin. GFP is visualized at 24 h by confocal microcopy and shows vegetal nβ-catenin in one half of the embryo and complete loss of nβ-catenin in the half of the embryo that developed from the Δ-cadherin-injected blastomere. Embryos are depicted in a lateral view, unless indicated by vp for vegetal pole view. (Q) Schematic showing the effects of different levels of Δ-cadherin on vegetal territory specification.