
Fig. 4.
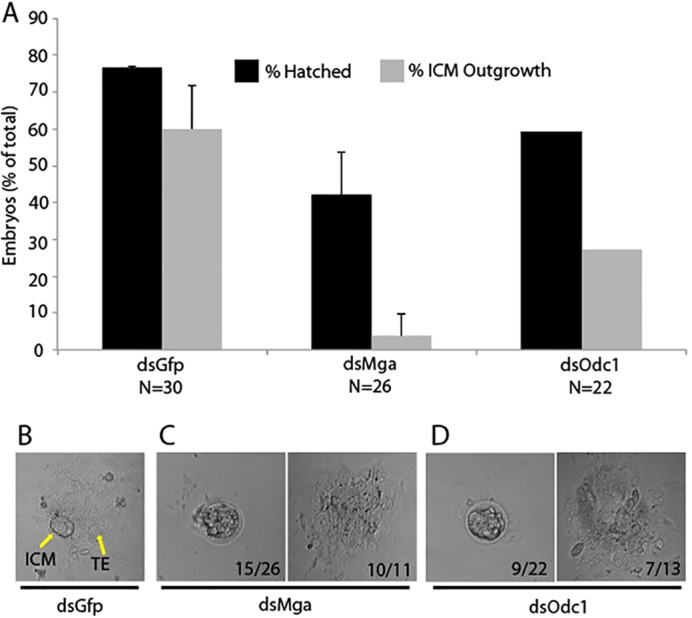
Knockdown of Mga or Odc1 results in ICM failure. (A) Results of outgrowth assays following injection with dsGfp, dsMga or dsOdc1. All injection groups developed to the blastocyst stage at similar rates (∼90%, not shown). Percentage of total embryos (N) that hatched and formed ICM outgrowths is shown for each group. (B) Control embryos (dsGfp) form obvious ICM colonies and TE outgrowths (yellow arrows). (C,D) Examples of the failure to hatch and failure to form ICM outgrowth after microinjection of dsMga or dsOdc1. The numbers in the panels refer to the number of embryos out of the total that failed to hatch (as shown) or the number of embryos out of the total that hatched and outgrew that failed to form an ICM (as shown).