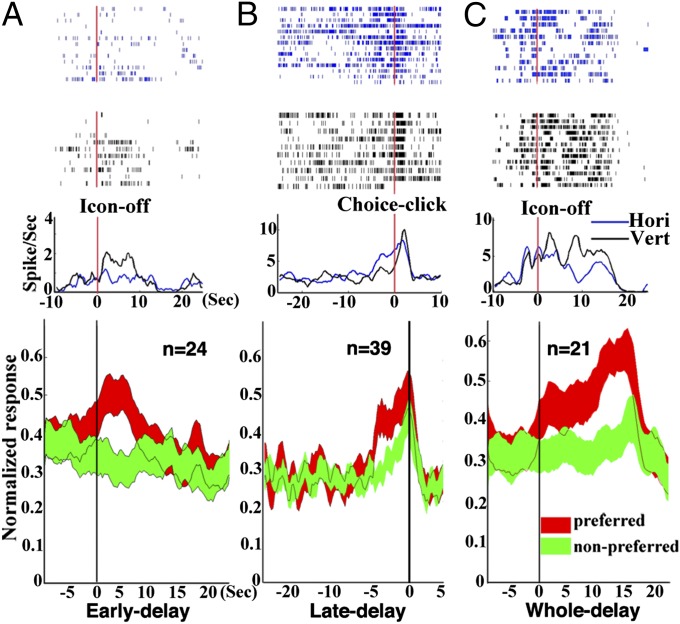
Fig. 3.
Delay-period differential activity and grand average firing rate in the VH task. (A, Upper) Rasters and histograms (bin size = 50 ms) of a cell showing early-delay (0–5 s) differential activity. The time-locking event for histograms is Icon-off (the beginning of the delay period). The cell shows a significantly higher firing rate (P < 0.01) in vertical trials. (Lower) The grand average firing frequency calculated from 24 early-delay differential cells (P < 0.001). The grand average firing frequency (±1 SEM) of cells for preferred objects (preference determined by significant higher firing frequency of either object) is indicated by the histogram in red, and for nonpreferred object is indicated by the histogram in green. (B) Rasters and histograms of a cell (P < 0.001) (Upper) and the grand average firing rate (Lower) showing late-delay differential activity of 39 cells (P < 0.001). The time-locking event for the histograms is Choice-click (the end of the delay period). (C) Rasters and histograms of a cell (P < 0.001) (Upper) and the grand average firing rate (Lower) showing whole-time delay differential activity of 21 cells (P < 0.001). The time 0 is the offset of the visual cue.

