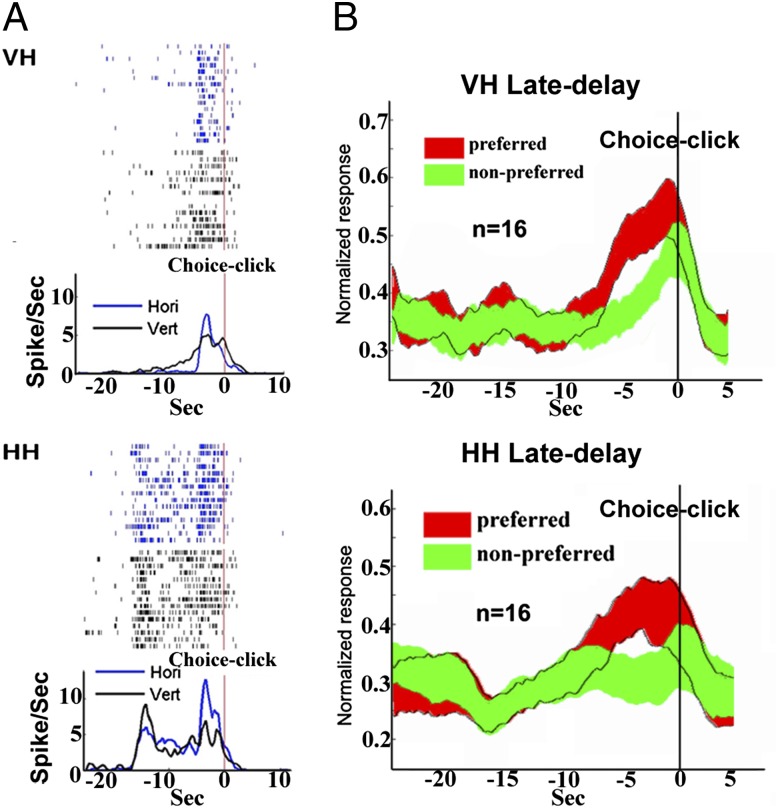
Fig. 4.
(A) Rasters and histograms (bin size = 50 ms) of a cell showing activity in the late-delay period recorded in both VH (Upper, P < 0.001) and HH (Lower, P < 0.001) tasks. The time-locking event for histograms in these two tasks is the choice click (the end of the delay period). (B) The grand average firing rate of late-delay differential activity of 16 cells recorded in both VH (P < 0.01) and HH (P < 0.01) tasks.

