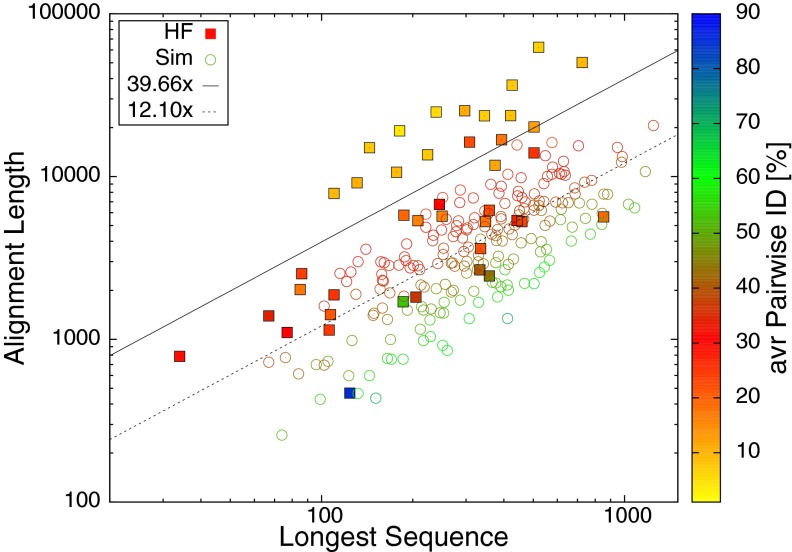
Fig. 1.
The length of the longest sequence in a protein family is given along the x axis; length of the final alignment is along the y axis. The alignments were produced using the phylogeny-aware program PAGAN. The 41 HomFam datasets (HF), as used in figure 5 of Boyce et al. (2), are rendered as solid squares; the 200 simulated datasets (Sim), as used in Tan et al. (1), are shown as open circles. The average pairwise identity in the alignments is rendered with color (blue/green, high identity; red/yellow, low identity). Lines represent average “inflation” of the alignments because of the alignment process: solid line 40-fold inflation for HomFam, dotted line 12-fold inflation for the simulated data.

