Fig. 1.
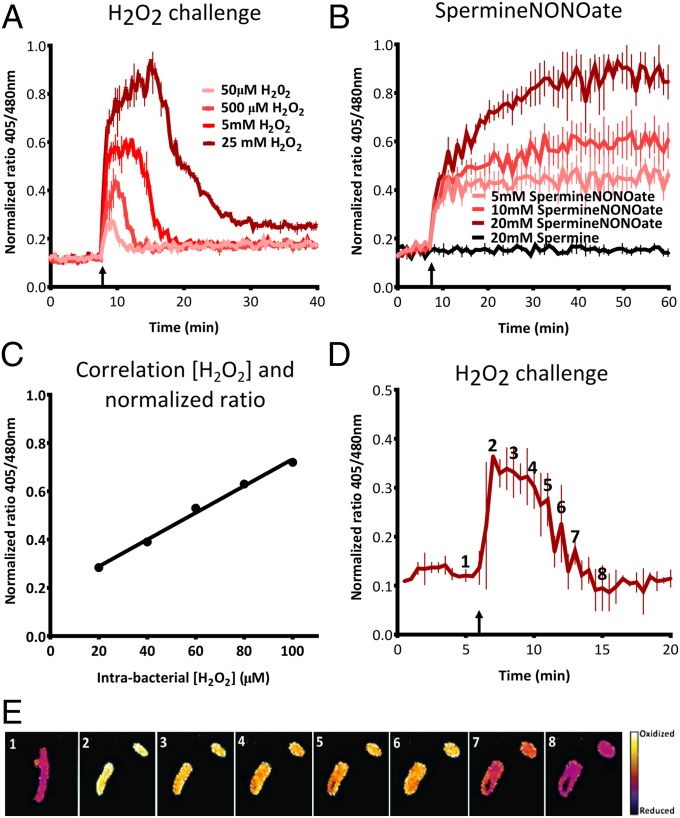
Real-time measurement of roGFP2 in S. Typhimurium. (A and B) Dose-dependent response of intrabacterial redox potential after a challenge with H2O2 (A) or SpermineNONOate (B), respectively. The upward arrow indicates injection of the oxidative compound. These experiments are done in LPM at pH 5.8. (C) Correlation between the intrabacterial H2O2 concentration and the normalized 405/480 ratio in HpxF(−) Salmonella. (D and E) Microscopic analysis of real-time response to challenge with 2.5 mM H2O2 in PBS. The false-colored ratio images are obtained after analysis by ImageJ. The numbers in the images in E correspond to the time points indicated in D.

