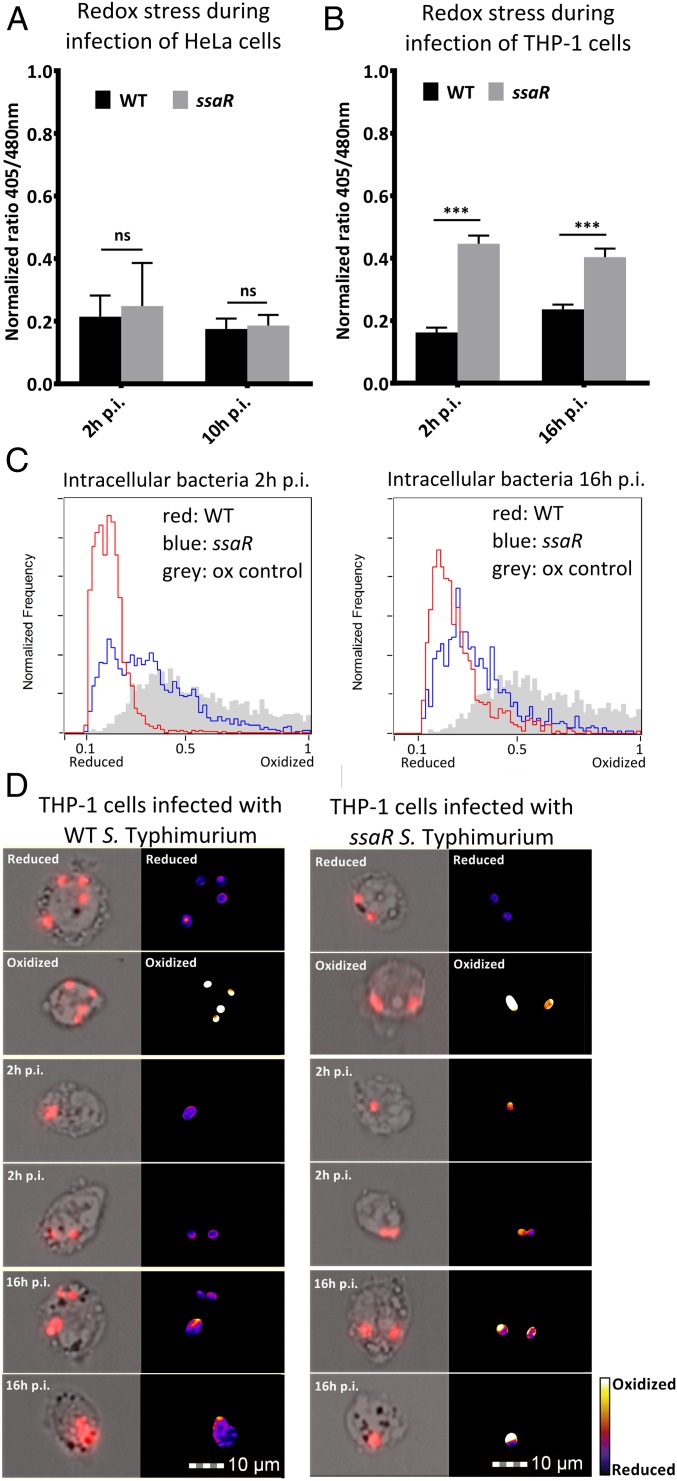
Fig. 3.
Involvement of SPI-2 system in ROS and RNS evasion. (A) Average intrabacterial redox potential of WT and ssaR S. Typhimurium in HeLa cells at 2 and 10 h p.i. (B) Average intrabacterial redox potential of WT and ssaR S. Typhimurium in THP-1 cells at 2 and 16 h p.i. over three separate experiments. Error bars indicate the SD. Each value represents analysis of at least 15,000 pictures. Significance was analyzed by a Student t test. (C) Representative pictures of infected THP-1 cells at 2 and 16 h p.i. Images on the Right are pseudocolored ratio images after analysis with ImageJ. (D) The 405/480-nm ratio histograms of intrabacterial redox potential after infection of THP-1 cells with WT and ssaR at 2 and 16 h p.i. The gray histogram represents the oxidized control, the red line represents WT ratio values, and the blue line represents ssaR ratio values.

