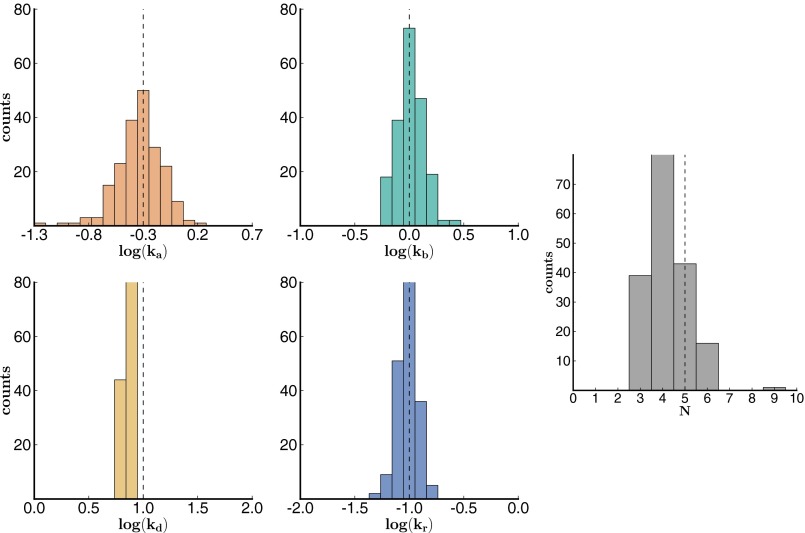
Fig. 3.
Histogram of bootstrapping results from simulated data set 2. Histogram of bootstrapping results from simulated data set 2 with 200 traces (200 bootstrap iterations). An overall bias toward slow is observed in the distribution. We will discuss how to correct for missed transitions, which gives rise to this bias, later. The theoretically expected results are shown in the dotted line.

