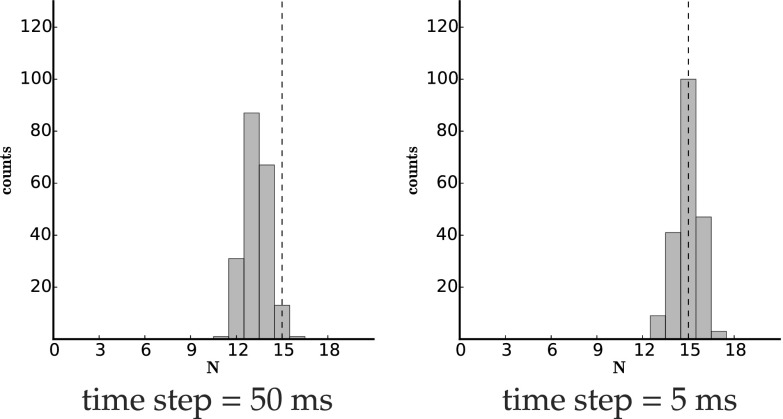
Fig. 5.
Histogram of N obtained by assuming rates. We demonstrate that we can accurately determine N if the rates are known. We use parameters from set 1 from Table 1 and use the simulated data to determine N (and not the rates). (Left) Shown with 50-ms time resolution (and therefore underestimated N). (Right) Improvement afforded by smaller time resolution (5 ms).

