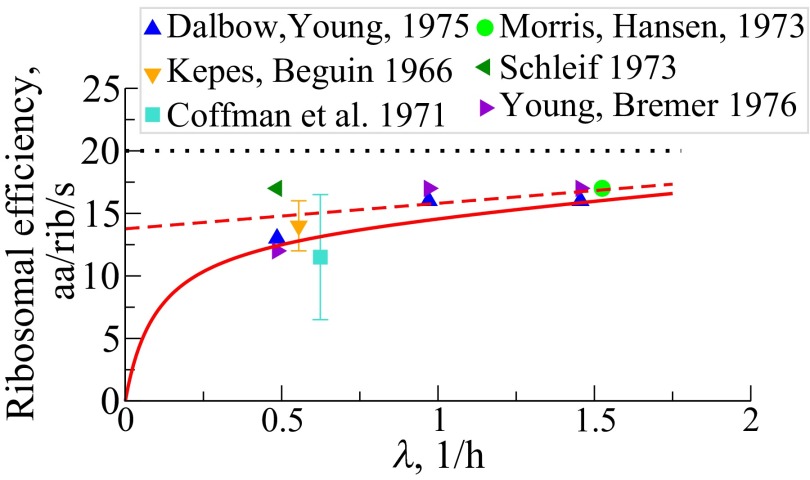
Fig. 5.
Net peptide elongation rate, per ribosome, , in units of amino acids per second per ribosome vs. cell growth rates, taken over both RPs and NRPs. The solid symbols are direct observations of peptide chain elongation (34–39). The red solid and the dashed lines are predictions with NRP turnover rate h−1 and , respectively [Eq. S14a; . (…) indicates maximal translation rate].

