
Fig. 5.
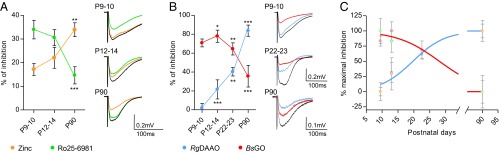
The identity of the coagonist is associated to the availability of GluN2A vs. GluN2B subunits at SC–CA1 excitatory synapses. (A) Inhibitory effect of zinc (250–750 nM; orange symbols) and Ro25-6981 (2–4 µM; green symbols) at SC–CA1 synapses throughout development (P9–P10, P12–P14, and P90). Corresponding average NMDA-fEPSP traces are illustrated on Right. (B) Inhibitory effect of RgDAAO (0.2 U/mL; blue symbols) and BsGO (0.2 U/mL; red symbols) during maturation (P9–P10, P12–P14, P22–P23, and P90). Corresponding average NMDA-fEPSP traces are represented on Right. (C) Data from A and B are normalized to the minimal and maximal inhibitory effects. The inhibitory effects of RgDAAO and BsGO are fitted with a sigmoidal dose–response curve (R2 = 0.9539 and 0.9641, respectively). *P < 0.05, **P < 0.01, and ***P < 0.001, using Student t test when comparing with previous developmental stage. All values represent the mean ± SEM.