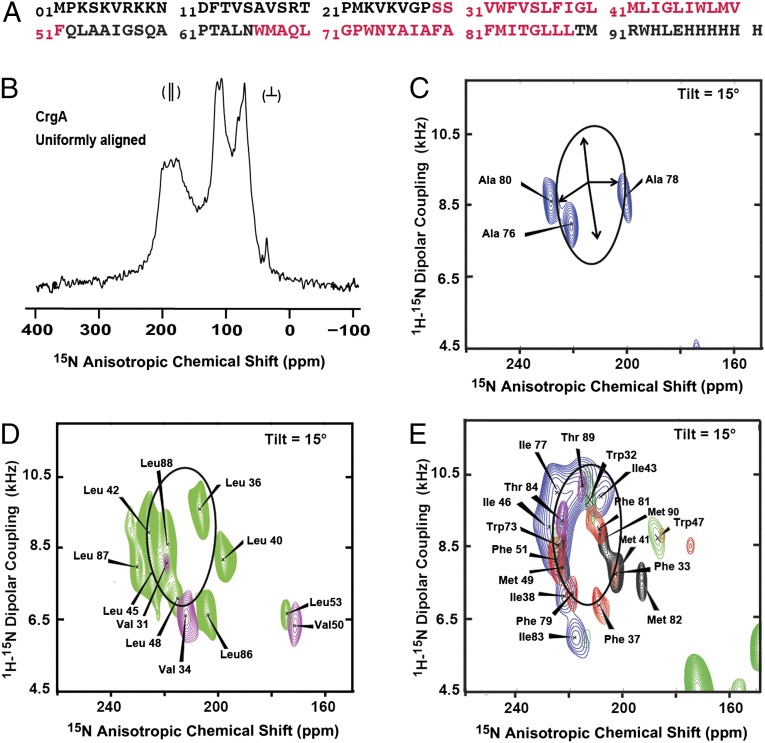
Fig. 1.
Amino acid sequence and ssNMR spectra of full-length Mtb CrgA membrane protein. (A) The sequence of the expressed CrgA with a C-terminal His6 tag. The predicted transmembrane (TM) helical residues (TMHMM, version 2.0) are indicated by red lettering. (B) One-dimensional 15N cross-polarization spectrum of 15N uniformly labeled CrgA with the bilayer normal parallel to the magnetic field. The resonance intensities near 200 ppm are from the TM helix residues, with their backbone amide NH bonds nearly parallel to the bilayer normal. The intensity near 120 ppm is from the highly dynamic sites, and most of the remaining intensity is from structured residues not in the TM domain. (C) Two-dimensional PISEMA spectra of 15N Ala-labeled CrgA with a superimposed PISA wheel calculated for an ideal helix [(φ, ψ) = (−60°, −45°)] with a 15° tilt angle relative to the bilayer normal. The set of four arrows in the middle of the PISA wheel define 90° rotational increments for the backbone nitrogen sites. Resonance assignments based on the PISA analysis are shown. (D) Superimposed PISEMA spectra of 15N Leu (green)- and 15N Val (purple)-labeled protein with resonance assignments. (E) Overlay of PISEMA spectra for 15N Ile (blue)-, 15N Met (black)-, 15N Thr (purple)-, 15N Phe (red)-, and 15N Trp (green)-labeled CrgA, with sequence-specific assignments shown. All spectra were collected at 60 MHz for 15N in oriented POPC/POPG (4:1 mol/mol) liquid–crystalline phospholipid bilayers, pH 7.0, 13 °C.

