
Fig. 1.
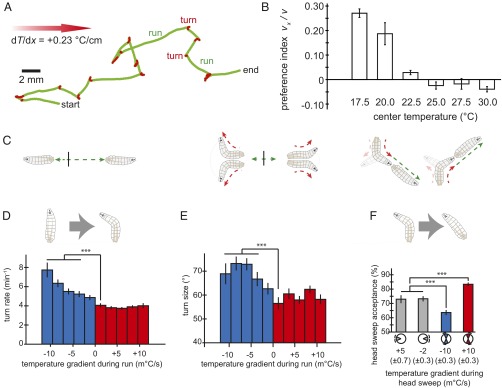
Precise dependence of sensorimotor transformations on temperature gradients. (A) Trajectory of an individual larva crawling for 120 s toward warmer temperatures (left to right) in a spatial temperature gradient of dT/dx = 0.23 °C/cm. The track is segmented into runs (green) and turns (red). Biases in the run-to-turn transitions (turn rate and turn size) and the turn-to-run transitions (turn direction) form the basis of navigation toward preferred conditions. (B) Population-level navigation as a function of the starting temperature on a spatial temperature gradient. Second-instar larvae crawl toward warmer temperatures when <22 °C and toward colder temperatures when above ∼28 °C. Preference index is defined as the mean component of velocity in the x direction divided by the mean speed. Each data point was calculated by using trajectories from 128 to 256 larvae, and error bars are ± SEM. (C) Illustrations of behavioral biases in larval motion. (C, Left and Center) A larva crawling parallel to the temperature gradient and starting at the vertical black line will use shorter runs (Left) and wider turns (Center) when headed toward colder conditions; a larva crawling perpendicular to the gradient will be more likely to turn toward the warmer side. (D) Larvae modulate turning rate and size in response to cooling. Turning rate as a function of the temporal gradients encountered by larvae during runs pointed in different directions while navigating the temperature gradients illustrated in A. For positive temporal gradients (red), turning rate is constant, regardless of the magnitude of the heating rate, whereas for negative temporal gradients (blue), turning rate progressively increases with gradient steepness. (E) Larvae also modulate turning size in response to cooling, with wider turns used in response to steeper cooling gradients and approximately the same size turns regardless of the steepness of warming gradients. (F) Trajectories as shown in A were separated into runs in four octiles (up the gradient, down the gradient, and two orthogonal to the gradient). We calculated the mean temporal gradient (± SEM) experienced during head sweeps succeeding runs parallel to the gradient (gray octiles), during head sweeps toward colder temperatures (blue octiles), and during head sweeps toward warmer temperatures (red octiles) after runs orthogonal to the gradient (run directions illustrated by octiles). Next, we calculated the probability of starting a new run during each head sweep in each condition. Statistics for D–F were calculated from trajectories exhibited by 85 wild-type larvae segmented into 3,642 discrete runs. Error bars are ± SEM. ***P < 0.001 (Mann–Whitney–Wilcoxon test for turn rate; Student’s t test for turn size and direction).