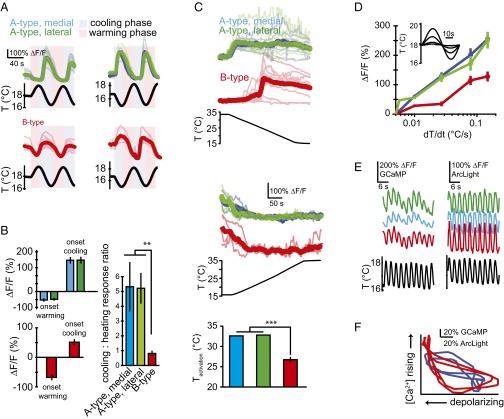
Fig. 4.
Optical neurophysiology of the thermosensory neurons. (A) Calcium activity in the three thermosensory neurons (two A-type sensors in green and blue and one B-type sensor in red; Fig. 3D) in response to temperature modulation in NP4486 > GCaMP3 larvae. Percent changes in fluorescence levels (ΔF/F) upon sine-wave temperature modulation. (A, Left) The +sin waveforms begin with the heating phase. (A, Right) The −sin waveforms begin with the cooling phase. Individual (thin lines) and mean (thick lines) are shown for the lateral and medial A-type (Upper) and B-type (Lower) neurons. (B) Physiological response to heating vs. cooling. Bar graph values represent averages of the max/min ∆F/F with respect to the initial F level before the onset of oscillating temperature waveforms. (B, Left) The A-type neurons (Upper Left) show a stronger response to cooling than do B-type neurons (Lower Left). n = 4–9 larvae used for each measurement. Error bars are ± SEM. **P < 0.01. (C, Top and Middle) Activation threshold during cooling ramps. Individual traces (thin lines) and mean traces (thick lines) are shown for the A- and B-type neurons during negative temperature ramps (Top) and positive temperature ramps (Middle). (C, Bottom) Histograms show the activation temperature of A- and B-type neurons (defined as the temperature coinciding with the half-maximal response response). n = 10 larvae used for each measurement. Error bars are ± SEM. ***P < 0.001. (D) Sensitivity of neuronal response to temporal gradients. Temperature sine waves of equal period (60 s) and varying amplitude (Inset) were applied while measuring calcium dynamics. The largest ΔF/F fractional change is plotted against the steepest temporal gradient within each cycle. n = 4–22 larvae used for each measurement. Error bars are ± SEM. (E) Representative traces of calcium dynamics (Left) and voltage dynamics (Right) measured using R11F02 > GCaMP5 and R11F02 > ArcLight larvae, respectively, during rapid temperature modulation (3-s period) in the three thermosensory neurons. (F) ArcLight fluorescence decreases with membrane depolarization, whereas GCaMP fluorescence signals increase with calcium levels. Representative traces of GCaMP vs. ArcLight fluorescence levels during sinusoidal temperature waveforms as shown in E show that calcium rises and falls with membrane depolarization and hyperpolarization, respectively, in both A-type (blue) and B-type (red) neurons.

