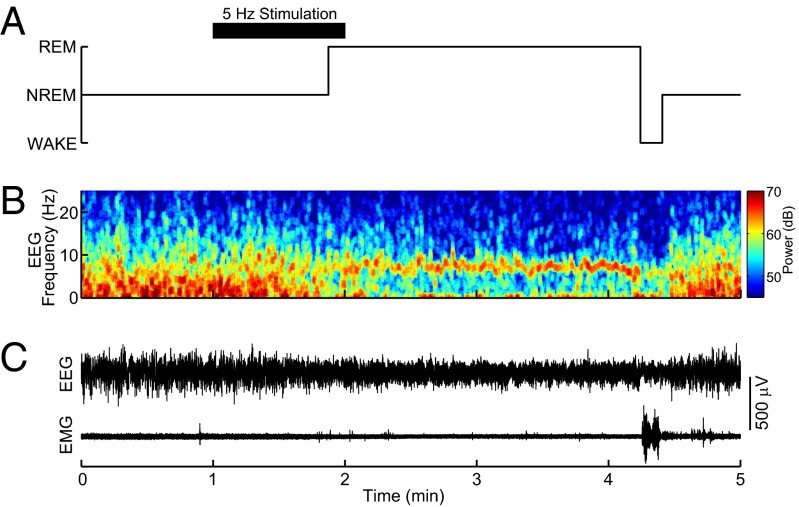
Fig. 3.
Representative example of optogenetic induction of REM sleep in ChAT-ChR2+ mice showing the unprocessed EEG and EMG traces. (A) Hypnogram of wake, NREM sleep, and REM sleep shows the changing sleep states across the stimulation. The black bar indicates the timing of optical stimulation (5-ms pulse at 5-Hz for 60 s). Sleep-wake states were determined by analyzing the power spectra of the EEG (B) and the raw EEG and EMG (C).

