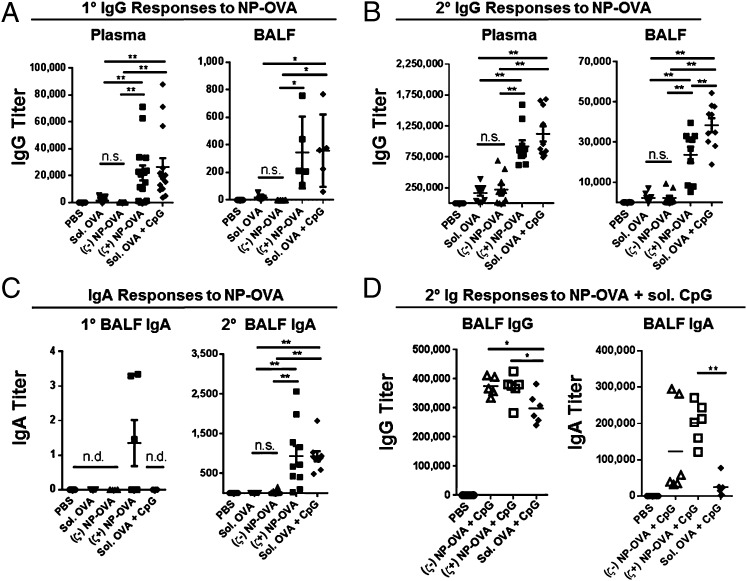
Fig. 4.
OVA-specific antibody titers in plasma and BALF of mice following pulmonary immunization with NP-OVA. (A–D) ELISA for OVA-specific IgG and IgA. (A) Plasma IgG (n ≥ 15), BALF IgG (n ≥ 5) following 1° immunization. (B) Plasma IgG, BALF IgG (n ≥ 10) following 2° immunization. (C) BALF IgA levels following 1° (n ≥ 5) and 2° immunization (n ≥10). (D) BALF IgG and IgA levels following 2° NP-OVA + soluble CpG (n ≥ 6). *P < 0.05, **P < 0.001; one-way ANOVA with Tukey’s multiple comparisons test. Plasma data in A are combined from three independent experiments, BALF data in A are representative of two independent experiments. BALF data in B are combined from two independent experiments. Data in C and D are representative of two independent experiments. Samples from combined experiments were analyzed simultaneously by ELISA; each experiment used independently synthesized NP and NP-OVA batches. NP dose = 100 µg per instillation (10 µg of OVA); CpG dose = 2.5 µg per instillation. Line represents mean ± SEM.

