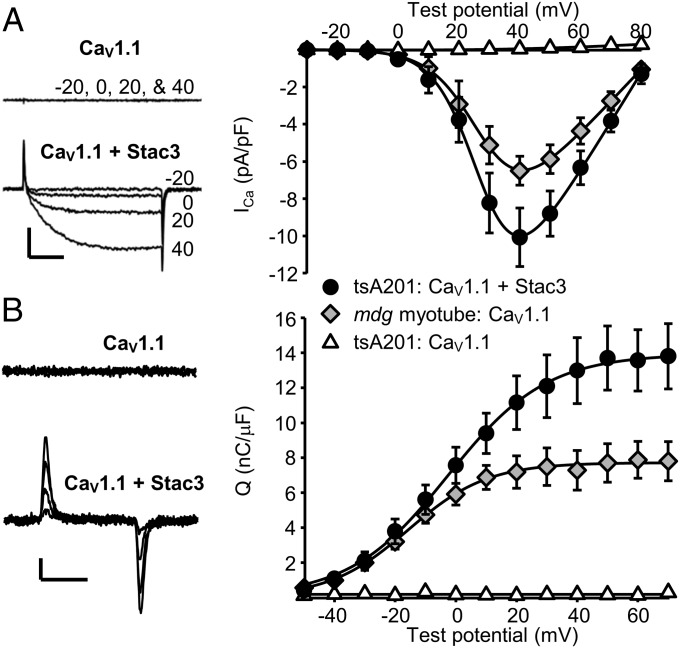
Fig. 2.
Stac3 promotes robust functional expression of CaV1.1 in tsA201 cells. (A) Representative ionic currents and peak I–V relationships for YFP-CaV1.1 in tsA201 cells either without Stac3 (open triangles, n = 10) or with Stac3 (solid circles, n = 14). (Right) Shown for comparison is the peak I–V relationship for dysgenic myotubes (null for endogenous CaV1.1), which were injected with cDNA encoding YFP-CaV1.1 (gray diamonds, n = 12). Calibrations: 5 pA/pF (vertical), 50 ms (horizontal). (B) Representative charge movements (depolarizations from −50 mV to −30 mV, −10 mV, 10 mV, and 30 mV) for YFP-CaV1.1 expressed in tsA201 cells either without or with Stac3. Calibrations: 1 pA/pF (vertical), 10 ms (horizontal). (Right) Average Q–V relationships for tsA201 cells expressing YFP-CaV1.1 with or without Stac3 and YFP-CaV1.1-expressing dysgenic myotubes are shown (symbols and numbers of cells as in A). The smooth curves (A and B, Right) are plots of Eqs. 1 and 2 (Materials and Methods) with the average parameters determined by fits of these equations to data from individual cells. Throughout, error bars represent ± SEM.

