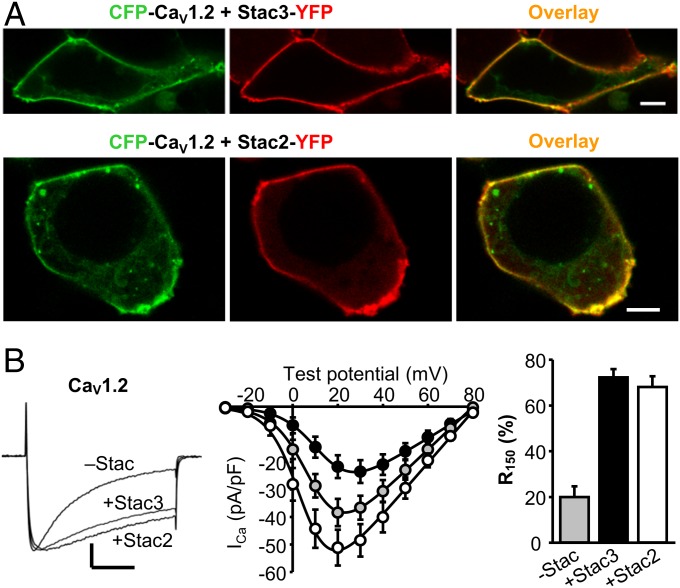
Fig. 5.
Stac3 and Stac2 associate with CaV1.2 in tsA201 cells and slow its inactivation rate. (A) Images of tsA201 cells coexpressing CFP-CaV1.2 (green) and either Stac3-YFP (red, Top) or Stac2-YFP (red, Bottom). (Scale bars, 5 μm.) (B, Left) Whole-cell Ca2+ currents in tsA201 cells expressing YFP-CaV1.2 without Stac 2 or Stac3 (Vtest = +20 mV) and YFP-CaV1.2 with either Stac3 (Vtest = +30 mV; vertically scaled 1.7-fold) or Stac2 (Vtest = +20 mV; vertically scaled 0.75-fold). Vertical calibration, 10 pA/pF (nonscaled current); horizontal, 50 ms. Peak I–V relationships (Center) and the fraction-of-peak current at 150 ms (Right) are indicated for YFP-CaV1.2 without Stac2 or Stac3 (gray symbols, +20 mV, n = 11) and YFP-CaV1.2 with either Stac3 (black symbols, +30 mV, n = 9) or Stac2 (white symbols, +20 mV, n = 10).

