Fig. 6.
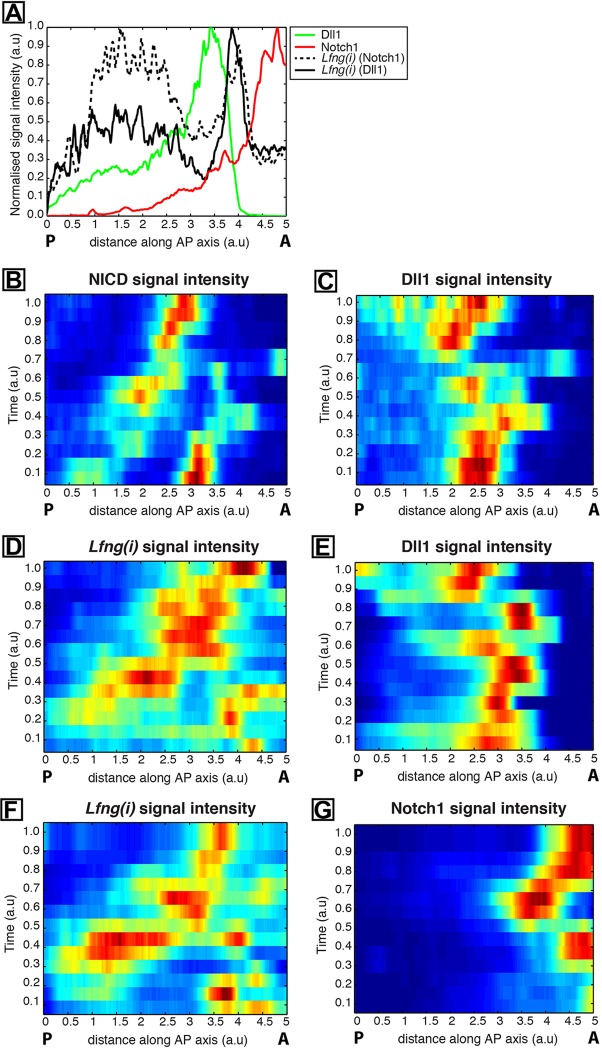
Quantification of spatiotemporal dynamics of Dll1 and Notch1 protein expression. (A) An example of an intensity plot depicting axial variation in signal intensity across the PSM. Data plotted from two explant pairs showing Lfng pre-mRNA (black broken line) in one explant compared with Notch1 protein (red) in the contralateral half explant, and Lfng pre-mRNA (black unbroken line) in a half explant from a second tail compared with Dll1 protein (green) in the contralateral half explant of the second tail. Measured intensities (y axis) are plotted against axial position [x axis; rostral (‘A’) to right and caudal (‘P’) to left]. (B-H) Kymographs show spatial distribution of Notch1, Dll1 and NICD, and of Lfng(i) across numerous PSMs. (B,C) NICD (B) and Dll1 (C) expression in PSM sections; (D,E) Lfng(i) (D) and Dll1 (E) in contralateral explant halves; (F,G) Lfng(i) (F) and Notch1 (G) in contralateral explant halves. a.u., arbitrary units.

