
Figure 1.
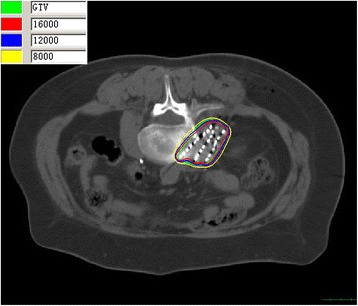
The isodose curve distribution of tumor after seed implantation from CT scan. The inner green curve represents GTV. The ellipses are isodose lines of 160, 120, 80 Gy from inside, respectively.
Official websites use .gov
A
.gov website belongs to an official
government organization in the United States.
Secure .gov websites use HTTPS
A lock (
) or https:// means you've safely
connected to the .gov website. Share sensitive
information only on official, secure websites.
The isodose curve distribution of tumor after seed implantation from CT scan. The inner green curve represents GTV. The ellipses are isodose lines of 160, 120, 80 Gy from inside, respectively.