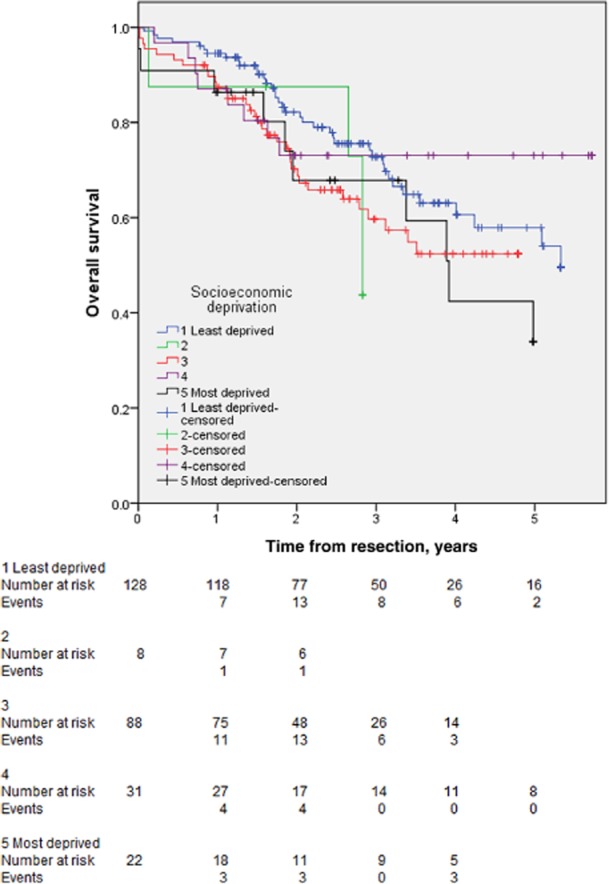
Figure 2.

Kaplan–Meier curves for overall survival in 303 patients with colorectal liver metastases submitted to liver resection stratified according to socioeconomic status. Categories 1–5 represent, respectively: wealthy achievers; the urban prosperous; the comfortably off; those of moderate means, and the hard-pressed
