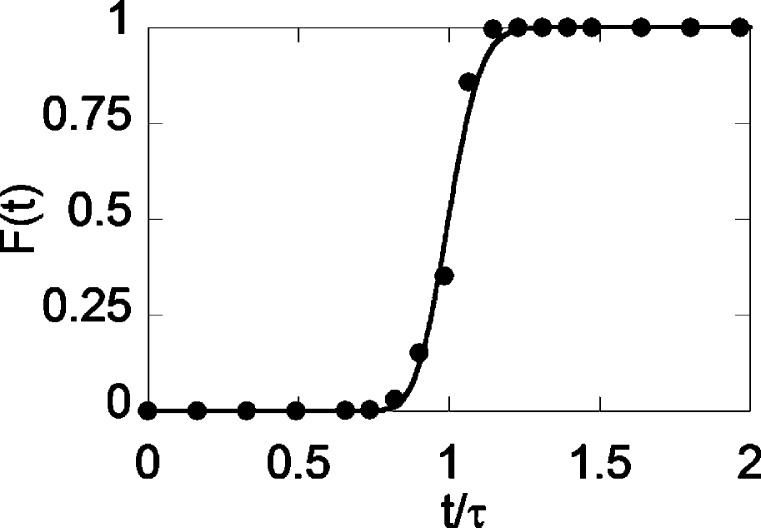
Figure 2.
Residence time distribution curve showing the step change response associated with the flow of benzyl alcohol starting at time t = 0 through the 1/2″ packed-bed reactor loaded with the Ru(OH)x/Al2O3 catalyst. The reaction was monitored by GC, with F(t) indicating the fraction of total [benzyl alcohol + benzaldehyde] detected from the reactor outlet as a function of time and τ corresponding to the mean residence time. Conditions: 20.8 g of Ru(OH)x/Al2O3, 0.5 mL/min liquid flow, and 40 sccm gas flow (8% O2 in N2) at 11 bar and 80 °C. The curve reflects a fit to an nCSTR model, with τ = 61 min and n = 137. See Experimental Section for further explanation.

