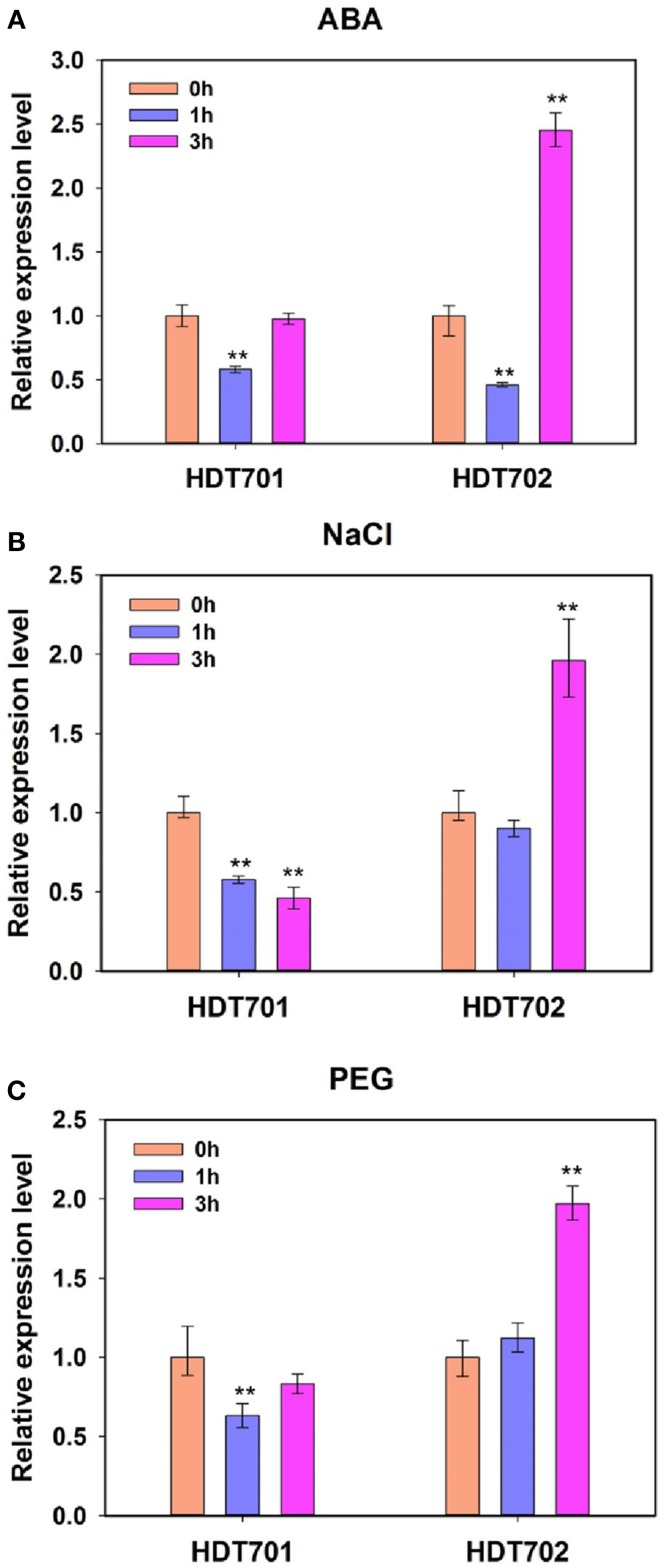
Figure 1.
Expression patterns of rice HDT701 and HDT702 under ABA, salt, and PEG stresses. Two-week-old rice seedlings were treated with 100 μ M ABA (A), 300 mM NaCl (B), and 20% PEG (C) for 0, 1, and 3 h, respectively. ACTIN was used as the internal control. Eighteen seedlings were used for analysis for each treatment. Values are shown as means + SD (t-test: **P < 0.01, difference from WT).

