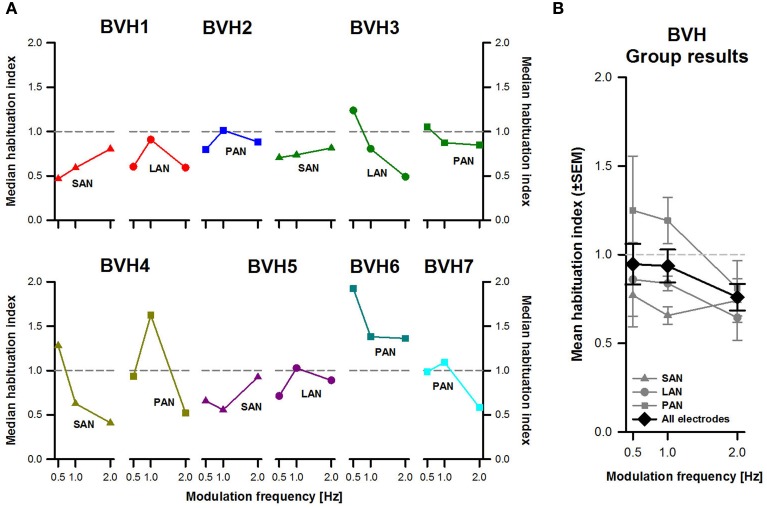
Figure 5.
Habituation-index vs. modulation frequency. (A) Each panel represents individual results obtained during stimulation for each stimulation site (SAN, LAN, PAN). (B) Mean results (±SEM) calculated across patients for each stimulation site (gray plots) and for all electrodes together (black plot).

