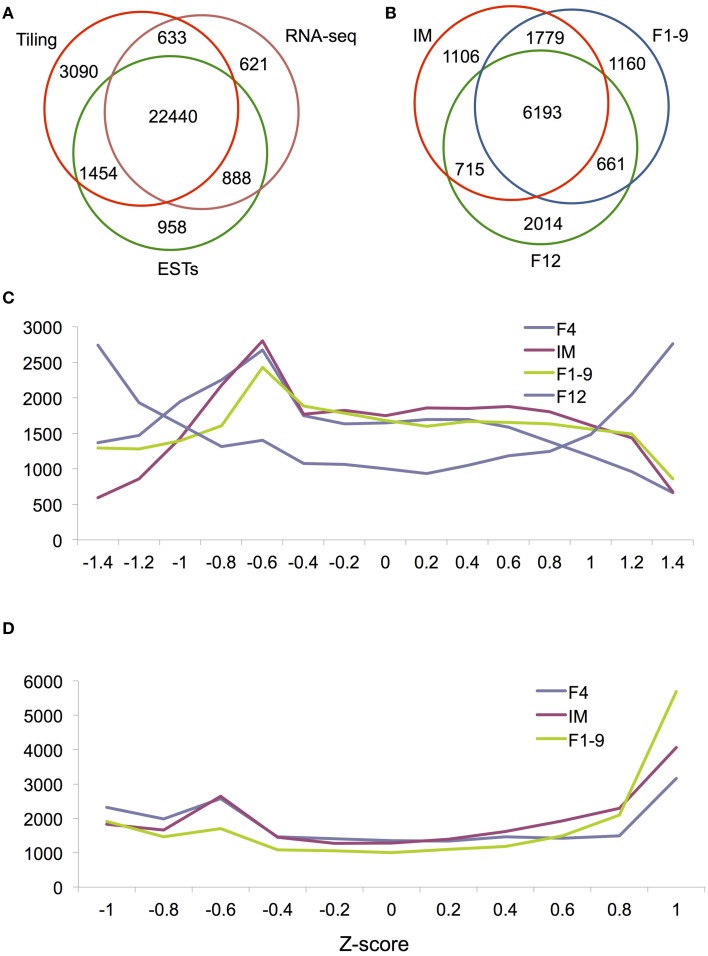
Figure 1.
Global gene expression during flower development. (A) A Venn diagram showing the overlap in detected genes between three technologies: the tilling array, RNA-seq and ESTs. (B) A Venn diagram showing the overlap between IM, F1–9, and F12 for genes called as DEG by RNA-seq. Histograms of relative expression levels (measured by Z-scores) in four (C) and three (D) organs. For easy visualization, we plotted Z-score on the x-axis and gene numbers on the y-axis.

