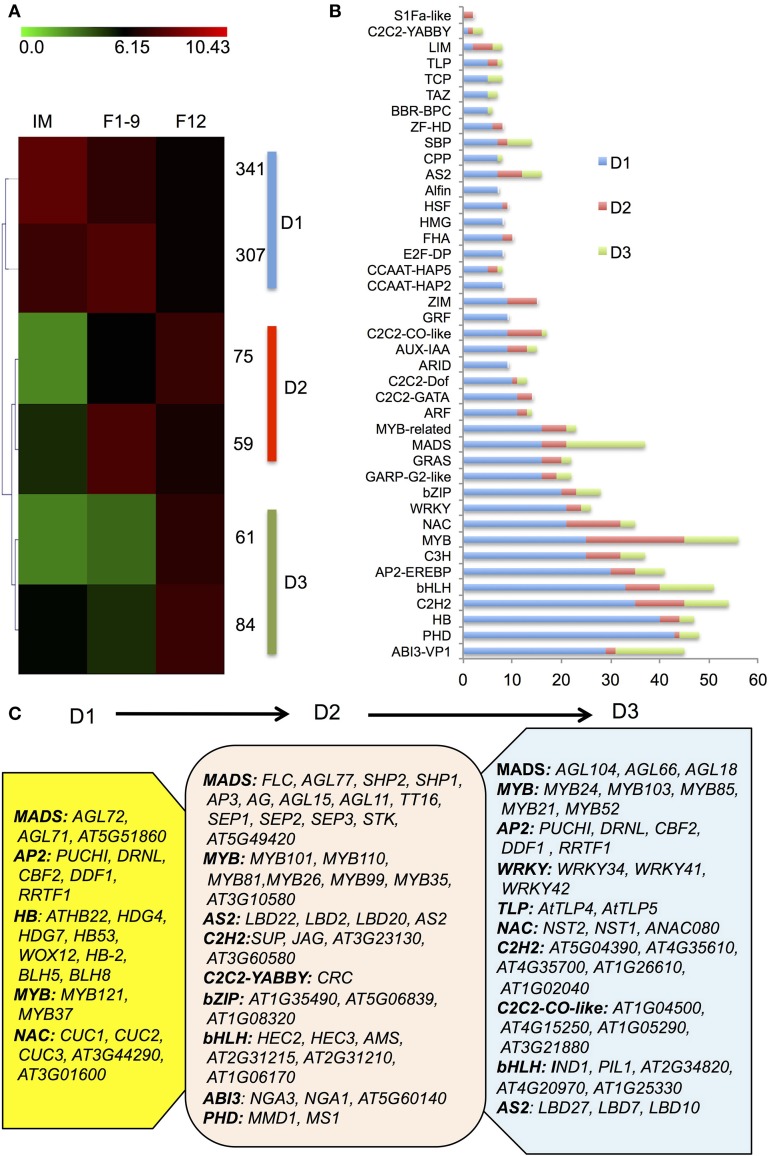
Figure 3.
The transcription factor accumulation profiles. (A) A heatmap for the transcription factors. 937 significantly differentially expressed transcription factors from IM, F1–9, and F12 were clustered into three groups (D1–D3) using the Self Organization Tree Algorithm. (B) Distribution of transcription factor families among D1–D3. (C) Representative functions and genes showing different transcription factor families for developmental stage-dependent groups D1 (IM), D2 (F1–9), and D3 (F12).

