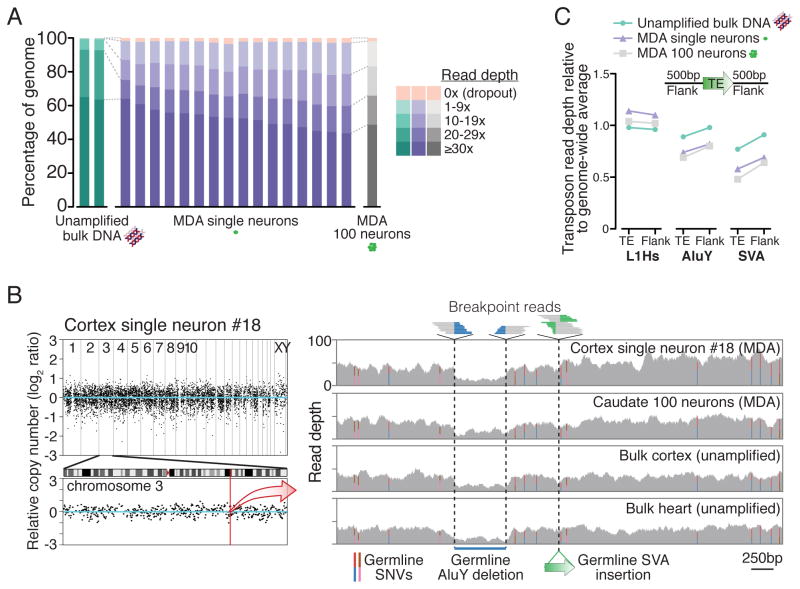
Figure 1. Single-neuron WGS genome coverage.
(A) Percentage of genome covered at specified read depths for all samples in this study. (B) Representative genome-wide coverage plot of single neuron #18 in ~500kb bins, with enlargement of chromosome 3 in which L1#2 was identified (Figure 2). See Figure S5 for plots of all samples. Right panel zoom of a 5kb region (chr3:147,605,344–147,610,345; hg19) shows single-neuron WGS simultaneous detection of 3 types of germline mutations, all concordant with 100-neuron and bulk samples: single nucleotide variants (SNVs, colored bars represent ratios of allele reads), a deletion (578bp AluY and additional flanking sequence), and an SVA retrotransposon insertion. All mutations have been previously identified in public polymorphism databases. (C) Average read depth of retrotransposon insertions annotated in the human genome reference and their 500bp flanks, relative to the genome-wide average read depth. Relative read depths correlate with average GC-content of each retrotransposon family (L1Hs: 42%; AluY: 54%; SVA: 63% GC content), due to GC amplification bias of MDA (see Table S2 and Supplemental Note 1).
See also Figures S1–S9 and Tables S1–S2.

