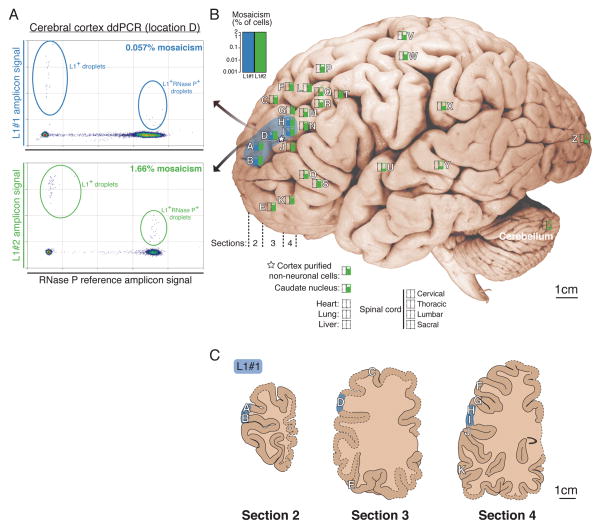
Figure 3. Mosaicism of somatic L1 insertions measured by ddPCR.
(A) Representative ddPCR plots of L1#1 and L1#2. L1+ droplets are plotted with larger points for better visualization. Reduced L1 signal in double-positive versus single-positive droplets is due to relatively higher PCR efficiency of RNaseP amplicons. (B) Mosaicism levels measured in individual UMB1465, plotted on a representative brain, using logarithmic box plots to indicate level of mosaicism. Empty rectangles indicate no detection. Blue shading indicates the estimated distribution of L1#1 in the middle frontal gyrus. The 16 WGS single neurons were originally obtained from location D (underlined). (C) Lucida tracings of cortex sections 2, 3, and 4 in which L1#1 was found, traced from photographs of sections. Dashed lines indicate regions that were not present in photographs of sections due to sampling prior to this study. Anatomy of these regions was extrapolated based on records of sampled locations, adjacent sections, photographs of right hemisphere formalin-fixed sections, and atlases of normal brain anatomy. Locations in which L1#1 was detected are highlighted in blue. See Figure S14 for diagrams of all sampled brain sections.
See also Figures S13–S15 and Table S4.

