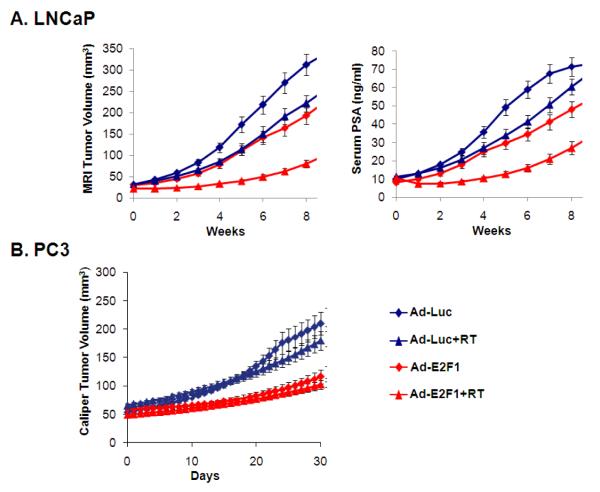
Fig. 4.
(A) Growth curves showing Ad-E2F1+RT treatments in orthotopically grown LNCaP tumors. The curves represent the average of numerical fits to the individual growth curves (n=16-17). Values for fast growing tumors are truncated at 100ng/ml for PSA and 400 mm3 for TV. (B) Growth curves showing Ad-E2F1+RT treatments in PC3 tumors. The curves represent the average of numerical fits to the individual growth curves (n=10).

