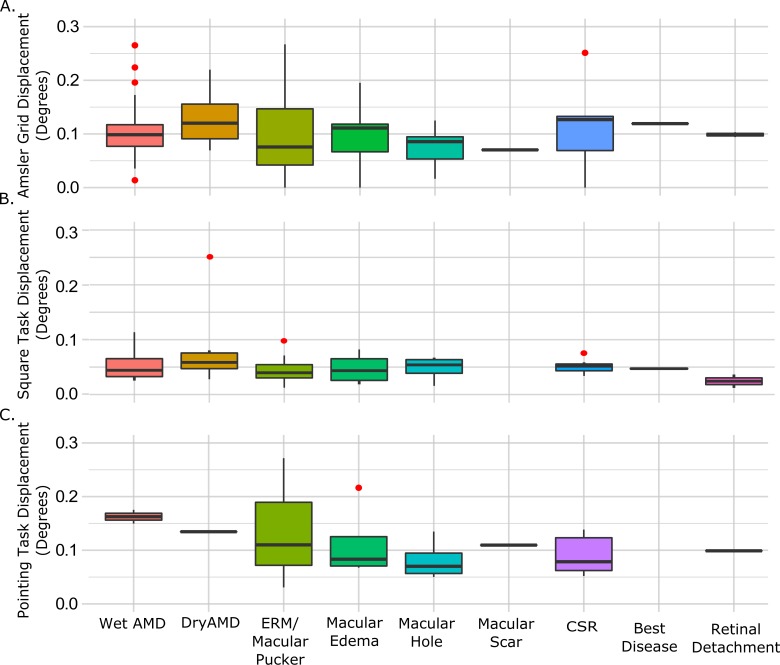
Figure 2.
Magnitude of distortion across diagnostic categories. Absolute magnitude of distortion in the Amsler grid (A), Square completion task (B) and dichoptic pointing task (C). Bars show median values, the span of the boxes show the interquartile range, the lines (whiskers) show 95% confidence intervals, and the red dots show outliers.

