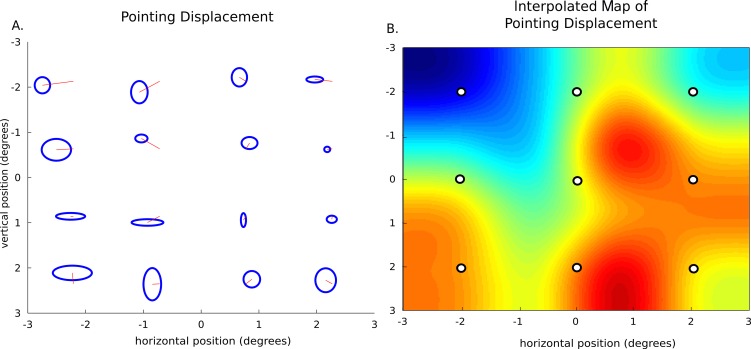
Figure 6.
Method of localized distortion measurements. Description of interpolation and localized measure selection. (A) Shows the displacement calculated from one participant's dichoptic pointing. Black lines represent the mean alignment endpoints at each of the 16-point locations, blue ellipses show the horizontal and vertical standard deviations. (B) Shows the interpolated map of the displacement around the 4.5 × 4.5° visual field. Blue color indicates displacement to the left and red indicates displacement to the right. The nine white points represent the sampled points used in the pairwise, location comparison across measurements.

