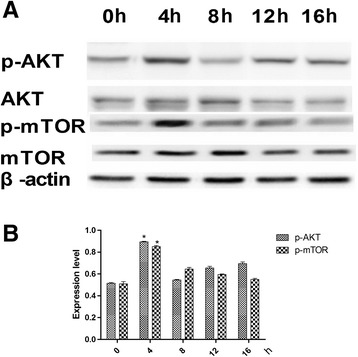
Figure 4.

Effects of MGF (45 nM) on the phosphorylation of AKT and mTOR at 0, 4, 8, 12, and 16 h on the 5th day of MGF treatment. (A) The expression levels of AKT, mTOR, phospho-AKT, and phospho-mTOR. (B) Contrast gray values for the phosphorylation of AKT and mTOR (*P < 0.05).
