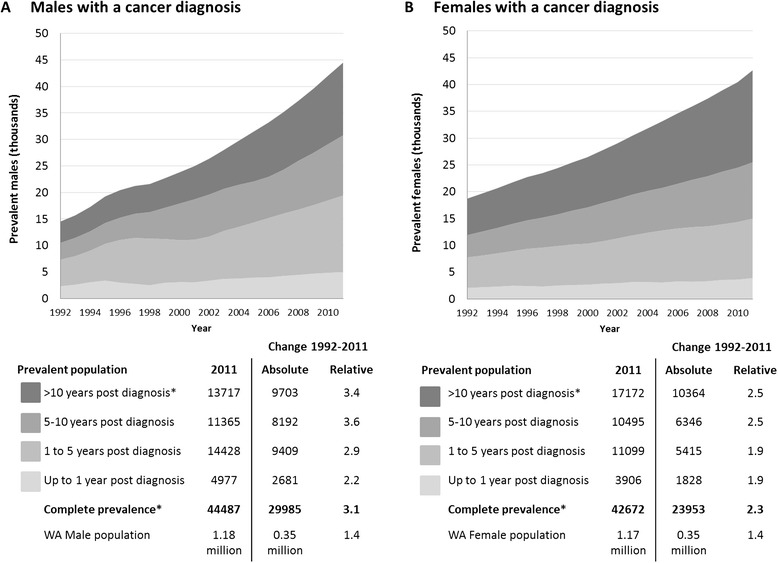
Figure 1.

Complete and limited-duration prevalence in males and females, 1992–2011. Figure 1 shows the cumulative prevalence for all cancers for males (A) and females (B) between 1992 and 2011 by time since diagnosis; up to one year, one to five years, five to 10 years, and more than 10 years. The table immediately below the chart lists the absolute prevalence numbers for 2011, along with the absolute and relative change in cancer prevalence and the WA population between 1992 and 2011.
