
Figure 5. Inhibition of the cell cycle lengthens circadian intervals and delays division phase.
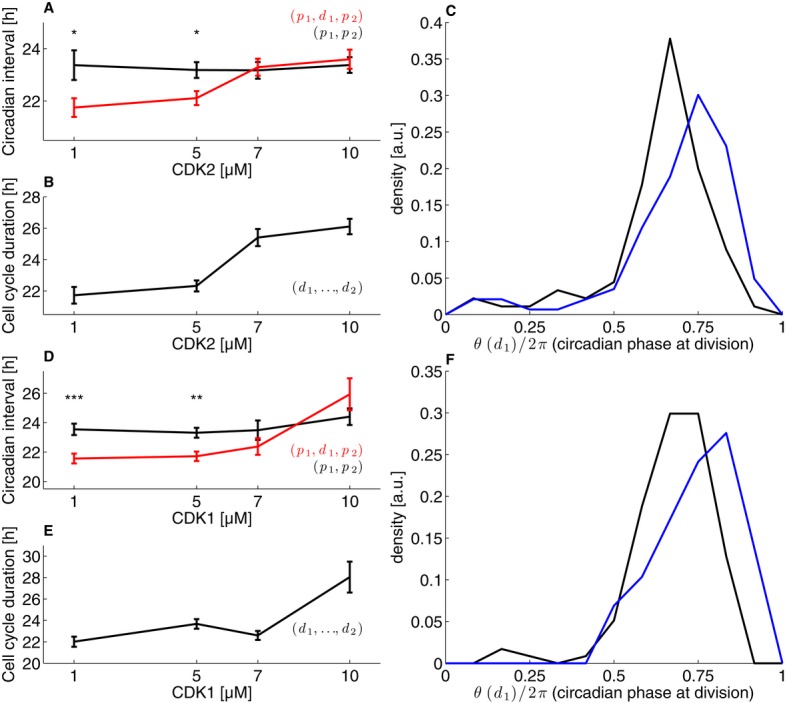
- Mean circadian intervals as a function of CDK2 inhibitor concentration for intervals with division (red) and without (black) show that intervals with division lengthen as the cell cycle duration lengthen. The error bars show the standard error on the mean.
- Mean cell cycle duration as a function of CDK2 inhibitor concentration.
- The distribution of normalized division times (circadian phase at division) at 1 μM CDK2 inhibitor (black) and 10 μM (blue) shows a significant shift (P < 1.2 × 10⁻⁵, K–S test) toward later phases.
- As in (A) for the CDK1 inhibitor.
- As in (B) for the CDK1 inhibitor.
- As in (C) for the CDK1 inhibitor (P < 0.003, K–S test).
Data information: In (A) and (D), significant difference between (p1,p2) and (p1,d1,p2) intervals is indicated (*P < 0.05; **P < 0.01; ***P < 0.001, t-tests). The dataset included n = 812 cells traces for the CDK2 and n = 711 for the CDK1 inhibitors, nearly equally distributed across concentrations.