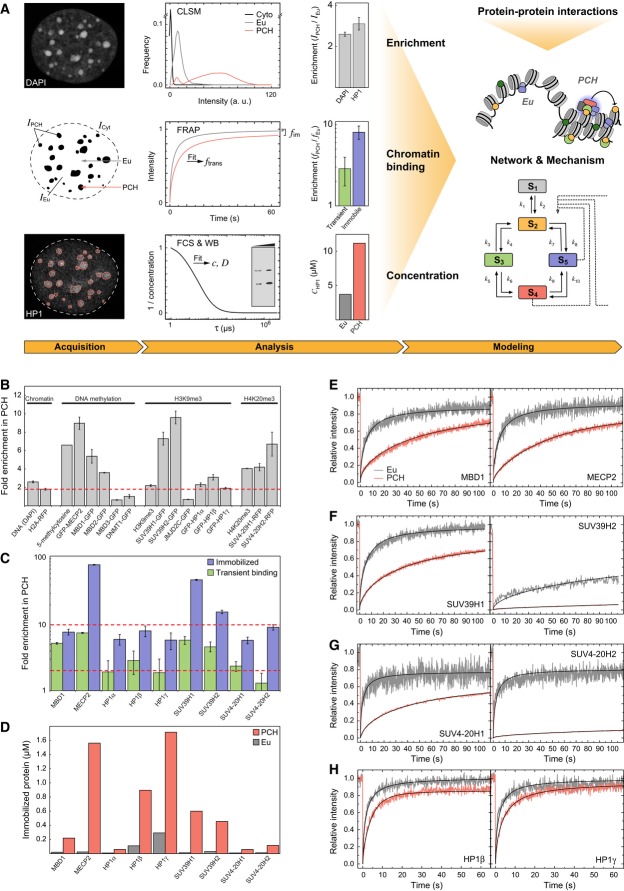
Figure 1. Quantitative analysis of core components of the pericentric heterochromatin (PCH) network.
- Workflow of integrative PCH network analysis. The enrichment of different factors in PCH was measured based on confocal laser scanning microscopy (CLSM) images. Abundance and chromatin interactions were determined by fluorescence fluctuation microscopy methods (FRAP, FCS). Additional information on protein–protein interactions was obtained as described in the text and in Fig 2. Based on the experimental data, a network model was developed that explains the stable maintenance of PCH.
- Enrichment of proteins, DNA methylation, H3K9me3, and H4K20me3 in PCH over euchromatic regions from fluorescence intensity measurements in G1 phase cells. The red line marks the chromatin compaction in PCH (1.8-fold enrichment of H2A-RFP). Labeled H2A, SUV39H1, and HP1 isoforms were stably expressed, the other proteins were transiently expressed, and modifications were immunostained. Error bars correspond to standard error of the mean (SEM).
- Enrichment of transiently bound and immobilized protein fractions in PCH versus euchromatin determined by FRAP. Red lines indicate 2-fold and 10-fold enrichment levels. Error bars correspond to standard deviation (SD).
- Absolute concentrations of stably bound proteins in the immobile FRAP fraction.
- FRAP experiments of transiently expressed MBD1 and MECP2 in PCH and euchromatin (Eu). Data were fitted to yield chromatin binding parameters.
- FRAP of SUV39H1 (stably expressed) and SUV39H2 (transiently expressed).
- FRAP of transiently expressed SUV4-20H1 and SUV4-20H2.
- FRAP of stably expressed HP1β and HP1γ. For additional data including HP1α, see Supplementary Table S2.

