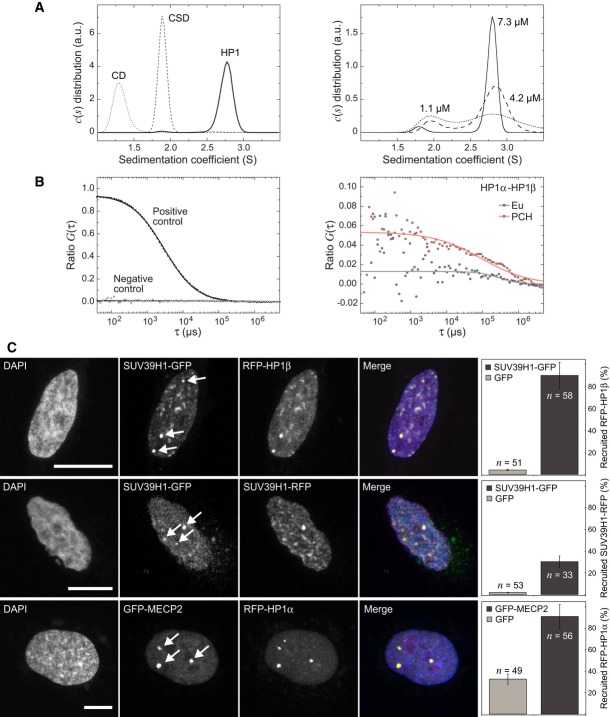
Figure 2. Protein–protein interaction analysis of HP1 and SUV39H1.
- Analytical ultracentrifugation (AUC) experiments of HP1β and its isolated domains. The sedimentation coefficient c(s) distribution obtained from AUC sedimentation velocity runs in the concentration range from 8–30 μM showed dimerization of HP1β and the CSD (left panel) (Supplementary Table S3). Larger complexes were not observed. HP1β dimers dissociated at lower concentrations, which is reflected by two peaks in the c(s) distribution (right panel). An equilibrium dissociation constant of 1–2 μM was determined from the relative molar fractions of monomer and dimer species.
- Protein–protein interaction analysis of soluble nucleoplasmic complexes by FCCS in transiently transfected NIH-3T3 cells. The parameter ratio G(τ) reflects the amount of complexes containing GFP- and RFP-labeled proteins. Control measurements were conducted with double-labeled beads in buffer (positive control) and with inert GFP and RFP transiently expressed in NIH-3T3 cells (negative control). For HP1, homodimers and heterodimers were found. Additional FCCS measurements for HP1 and SUV39H1 are shown in Supplementary Fig S5A.
- F2H interaction analysis of SUV39H1 and other PCH proteins. Human U2OS cells were co-transfected with GBP-LacI and the indicated GFP and RFP constructs, resulting in tethering of the GFP-tagged protein to the three lac-operator integration sites. HP1β interacted with SUV39H1 in living cells with the percentage of colocalizations displayed in the barplot. Self-association of SUV39H1 and HP1α recruitment by MECP2 was also demonstrated. Isolated GFP was used as a negative control. Scale bars, 10 μm. Error bars correspond to SD. Further F2H interaction measurements are shown in Supplementary Fig S5B.

