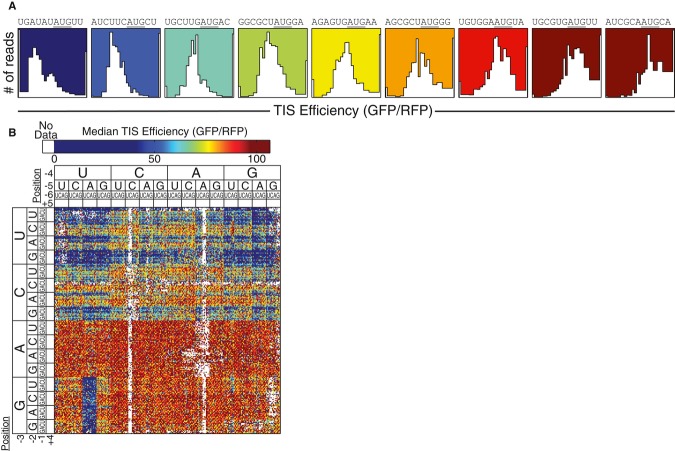
Figure 2. TIS efficiency determined by FACS-seq.
- Individual FACS-seq histograms spanning a range of translation efficiency values. The background color corresponds to the median translation initiation efficiency. The TIS sequences are indicated above each histogram.
- Heat map of entire TIS sequence space. The sequences were arranged to highlight trends in TIS strength. The +4/+5 positions were not labeled, but they follow the same nucleotide order of U/C/A/G.

