
Figure 6. Genome-wide analysis of human translation initiation efficiency.
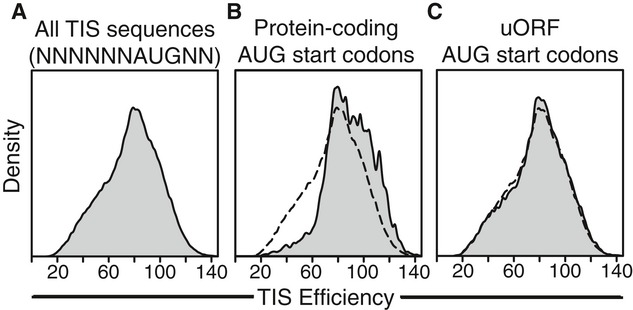
- Distribution of the initiation efficiencies for the entire TIS sequence space (i.e., all permutations of the motif NNNNNNAUGNN).
- Distribution of initiation efficiencies for all annotated human TISs.
- Distribution of TIS efficiencies for all human uORF TISs (i.e., AUG start codons located in 5′ UTRs). Distribution of efficiencies for all TIS sequences included for comparison (dashed-line, B and C). Efficiency values were predicted with the dinucleotide PWM. A value of 100 corresponds to the TIS efficiency of GCCACCAUGGG.