
Figure 8. Ribosome footprint profiling of genes with predicted truncation isoforms.
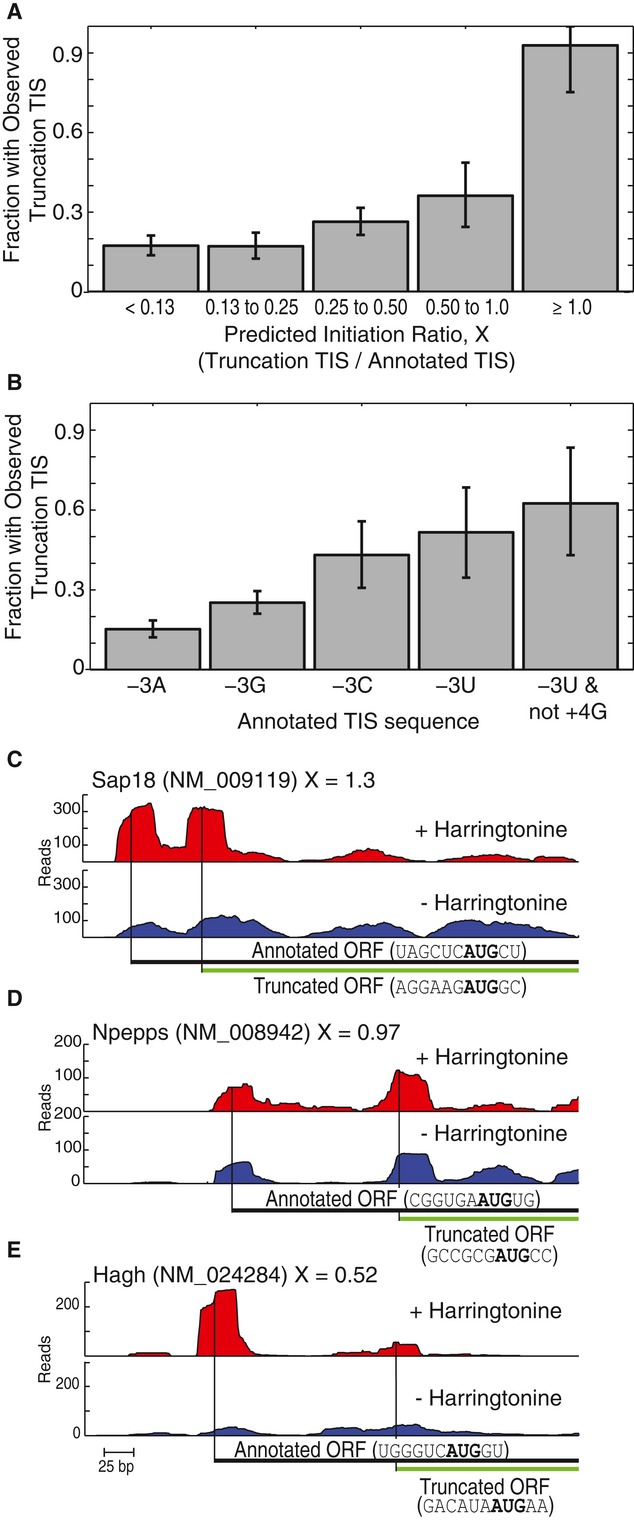
An in silico quantitative leaky scanning model predicted the ratio,
X, of initiation at truncation TISs relative to the initiation at annotated TISs.
The predictions were compared to ribosome footprint profiling data from mouse embryonic stem
cells.
- A The fraction of transcripts where ribosome profiling supports initiation at the truncation TIS grouped by predicted initiation ratio, X. Error bars represent 95% C.I.
- B Same as (A), but transcripts were grouped by the −3 and +4 positions of the annotated TIS.
- C–E Examples of transcripts with observed initiation at the truncation TIS. Ribosome density provided for transcripts with and without harringtonine treatment. The full-length annotated ORFs and the predicted truncated ORFs are indicated with their TIS sequences. Gene names, transcript names, and predicted initiation ratios are provided.