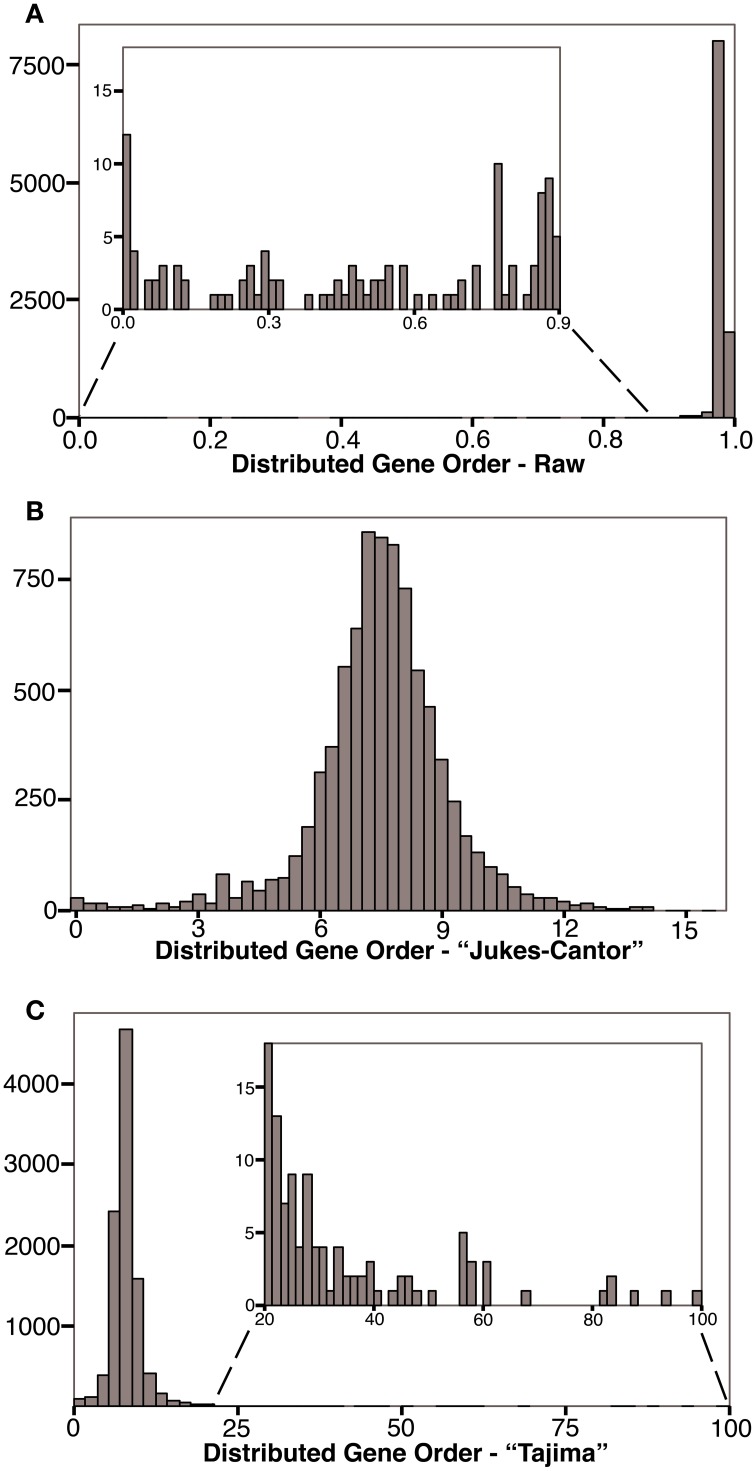
Figure 2.
Histograms showing the frequency of gene order distances calculated for 143 prokaryotes. (A) Distribution of raw gene order distances. The predicted distance for randomly ordered genomes is 0.983, 82% of the genome pairs have raw distances less the 0.983. (B) Distribution of distances after a Jukes-Cantor type correction. The predicted “Jukes-Cantor” gene order distance for randomly ordered genomes is >16. Some highly distant genome pairs are not shown in (B) because this logarithmic correction cannot be applied to distances greater than that expected randomly. (C) Distribution of Tajima-corrected gene order distances. Highly distant genome pairs are extreme outliners due to large corrections applied. Without these genome-pairs, the distribution is similar to that shown in (B).

