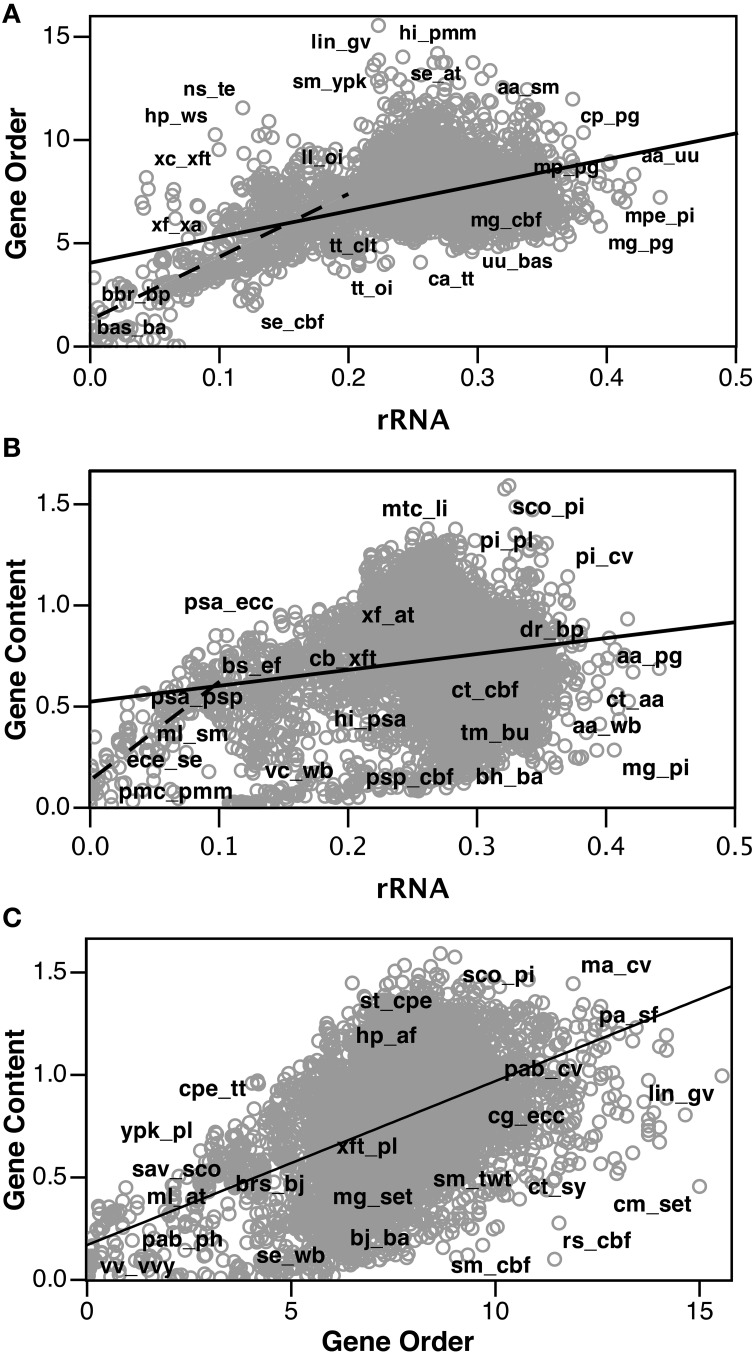
Figure 3.
Comparison of “Jukes-Cantor” distributed gene order distances with ortholog gene content and Jukes-Cantor rRNA distances. Select gene pairs have been labeled. (A) Gene order distance plotted as a function of rRNA distance. Solid line is linear regression of all data (R2 = 0.24). Dashed line is a linear regression for genome pairs with rRNA distances <0.2 (R2 = 0.52). (B) Gene content distance plotted as a function of rRNA distance. Solid line is linear regression of all data (R2 = 0.04). Dashed line is linear regression for genome pairs with rRNA distances <0.1 (R2 = 0.67). (C) Gene content distance plotted as a function of gene order distance. Solid line is linear regression of all data (R2 = 0.22).

