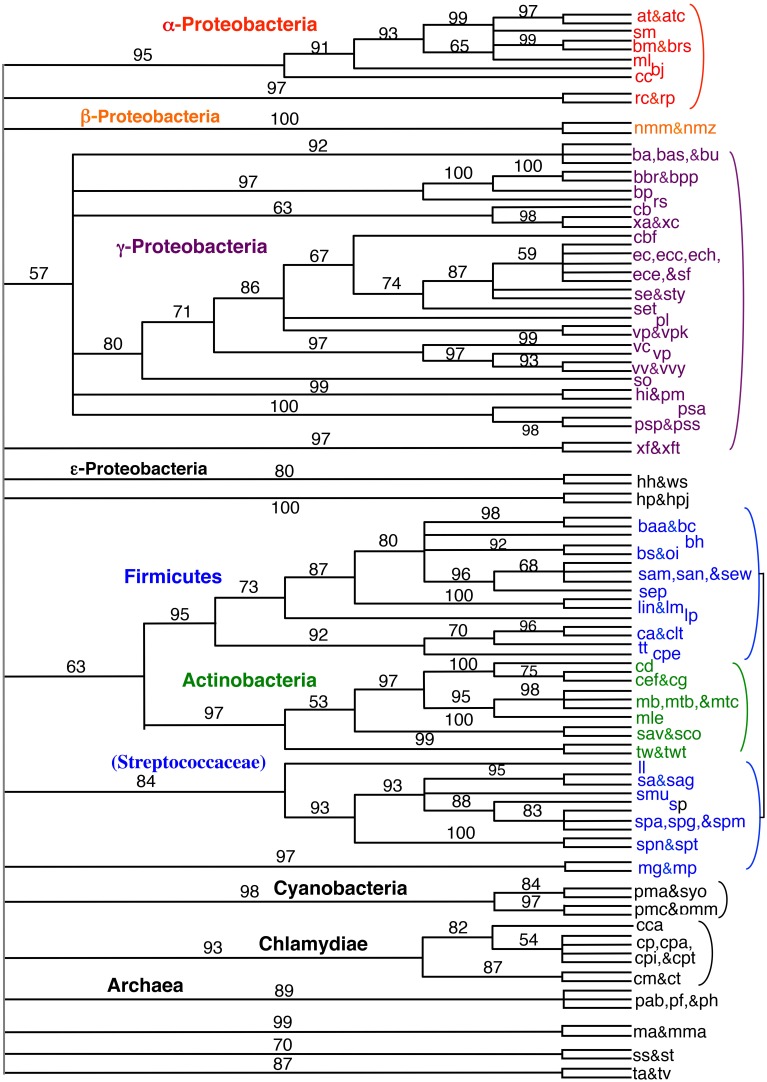
Figure 5.
“Bootstrap” NJ cladogram of the gene order distance tree shown in Figure 4. Each node shows the number of times that node appears in 100 replicate trees each using gene order distances based on 100,000 iterations. Select taxonomic groups are labeled with the same color scheme as used in later figures.

