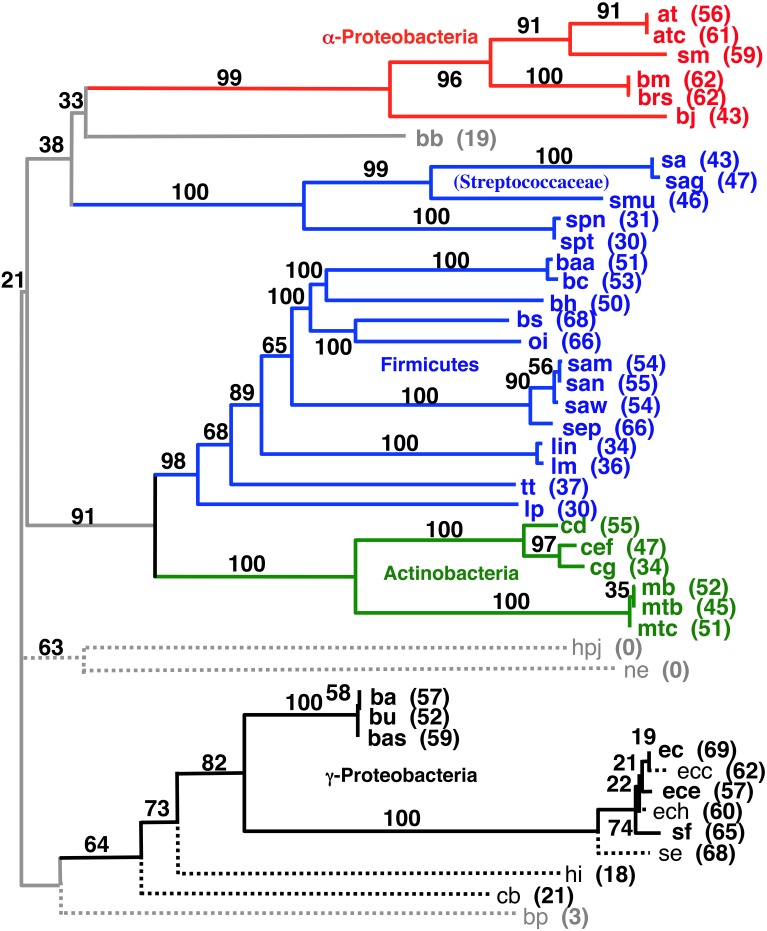
Figure 6.
Midpoint-rooted NJ phylogram based on our hierarchical tree building starting with 143 genomes (see Materials and Methods) using the same gene order data distances as the tree shown in Figure 4. This resultant tree includes the most taxa during the initial round of clustering with solid lines and bold font. Taxa connected with dashed lines are those found to be compatible during a second round of single taxon addition. “Bootstrap values” shown are the number of times a node is found when NJ trees are formed using these taxa and the 100 replicate gene order distances. The values listed for individual taxa are the number of times that taxon is found in the biggest tree formed by the initial round of clustering when the 100 replicate gene order distances are used. Taxa not shown that were found 60 or more times in the largest tree after the initial clustering were: vc (70), cbf (67), vv (65), sty (63), set (61), and vp (60).

