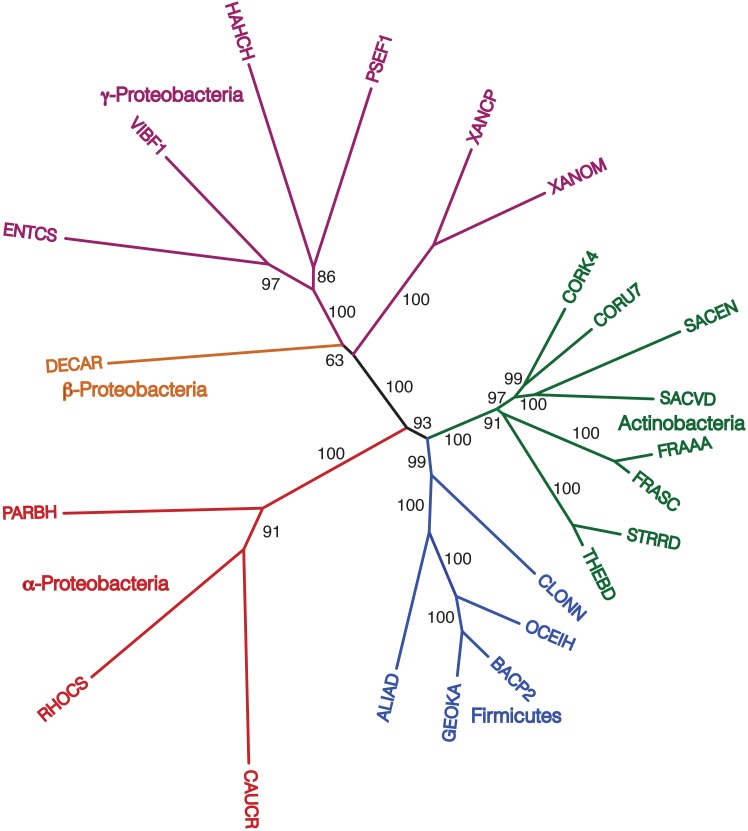
Figure 8.
NJ phylogram, starting with 172 representative taxa, limited to only the 23 taxa found in the agreement subtrees for the 100 replicate trees formed using iterations of six predicted orthologs. “Bootstrap values” shown are the number of times a node is found when NJ trees are formed using these taxa and the 100 replicate gene order distances.

