Figure 3.

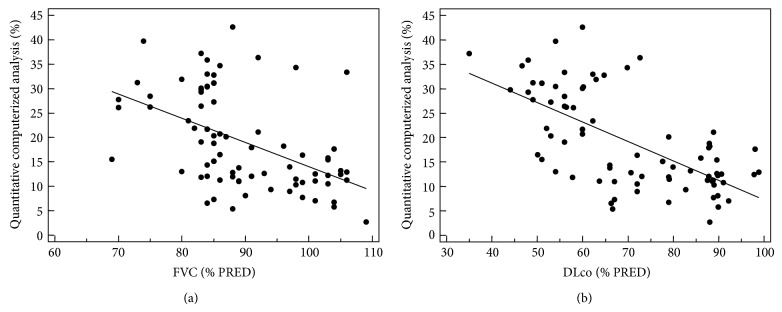
Scatter plots showing correlations between PFTs and quantitative computerized analysis of pulmonary fraction with regression line. Each circle shows a single patient data.

Scatter plots showing correlations between PFTs and quantitative computerized analysis of pulmonary fraction with regression line. Each circle shows a single patient data.