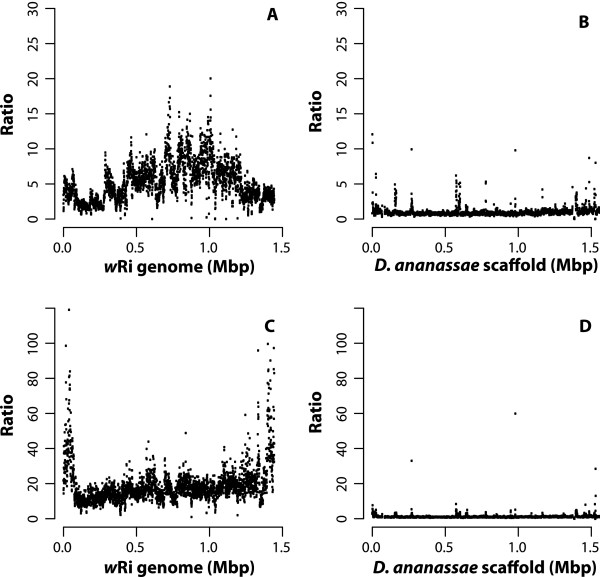
Figure 4.

Comparison of the coverage patterns. The coverage of the Indonesia genome is shown relative to that of the Hawaii line by dividing the values for Hawaii line by those of the Indonesia line across the wRi genome (Panel A) and the Drosophila ananassae genome (Panel B). The coverage of the India line relative to the Hawaii line is illustrated in the same manner (Panels C and D). While the India line has the same pattern of duplication as Hawaii, that pattern is different in the Indonesia line.
