
Figure 1.
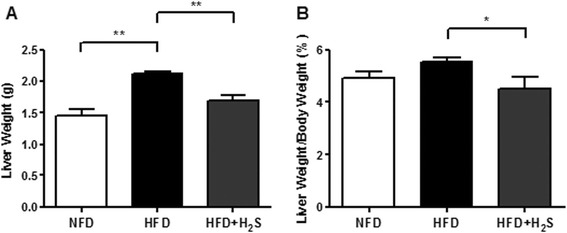
Effects of H2S on the liver mass of HFD-induced obese mice. (A) Liver weight. (B) The ratio of liver weight vs body weight. Data are means ± SEM (n = 10).*p < 0.05, **p < 0.01 vs. HFD group.
Official websites use .gov
A
.gov website belongs to an official
government organization in the United States.
Secure .gov websites use HTTPS
A lock (
) or https:// means you've safely
connected to the .gov website. Share sensitive
information only on official, secure websites.
Effects of H2S on the liver mass of HFD-induced obese mice. (A) Liver weight. (B) The ratio of liver weight vs body weight. Data are means ± SEM (n = 10).*p < 0.05, **p < 0.01 vs. HFD group.