Figure 1.

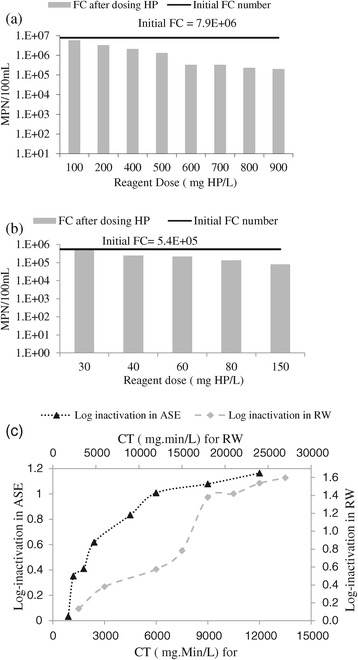
Reduction of fecal coliforms in phase 1 of the experiments; in RW (a), in ASE (b), and log inactivation vs the CT factor using HP (c).

Reduction of fecal coliforms in phase 1 of the experiments; in RW (a), in ASE (b), and log inactivation vs the CT factor using HP (c).